Download
1 / 14
140 likes | 214 Views
Choosing Sample Size and Using Your Calculator. Presentation 9.3. Margin of Error. The margin of error (m) of a confidence interval is the plus and minus part of the confidence interval

E N D
Choosing Sample Size and Using Your Calculator Presentation 9.3
Margin of Error • The margin of error (m) of a confidence interval is the plus and minus part of the confidence interval • A confidence interval that has a margin of error of plus or minus 3 percentage points means that the margin of error m=.03. Margin of Error
Margin of Error • A common problem in statistics is to figure out what sample size will be needed to obtain a desired accuracy or margin of error. • This is essentially algebra problem.
Determining Sample Size • Set up the following to obtain a margin of error m. • p* is you best guess of the proportion (remember you determine sample size before you actually take the sample). • More on this p* later. • Then, solve for n. • Be sure to ALWAYS round up. • If you round, for example 5.023 to 5, your margin of error will come out just a hair to big. • So, err on the side of caution and ALWAYS round up!
Sample Size • The margin of error desired m, is usually provided in the problem. • The value z* is determined by the level of confidence that is desired (typically 90%, 95%, or 99%). • The p* value is your best guess about the value of the true p. • So we are trying to do a study to estimate p, but we need to know p or p* to compute the needed sample size. This seems impossible! • What to do, what to do?
Sample Size • Do the best you can. • Give the best or most current state of knowledge about p as p*. • Many times there is some information or hint about what p might be. • If you know absolutely nothing, then use p*=.5 as that will create the largest standard error and thus guarantee your margin of error. • This is again erring on the side of caution.
Why use p*=.5? • Here is a graph of p*(1-p*) for values of p*: p*(1-p*) .25 p* p*=0 .5 1 So you can see that using p*=.5 gives you the largest standard error.
Why use p*=.5 • The graph shows that p*(1-p*) will be largest when p*=.5. • This means the sample size will be largest when p*=.5. • Which means that the sample size will be at least as big as actually needed. • This is being conservative as you are using more data than you would actually need to achieve the desired margin of error.
Sample Size Example #1: Home Court Advantage • Home Court Advantage • In watching n=20 college basketball games, it seems as if the home team usually wins. • In fact, the home team won 14 times in 20 games. • This means p-hat = 14/20 = .7 or 70% of the time! • What is a 95% confidence interval for true home court win proportion p?
Sample Size Example #1: Home Court Advantage • Calculate the confidence interval • A 20% margin of error! • That is unacceptable and a rather useless confidence interval! • It’s simply way too wide!
Sample Size Example #1: Home Court Advantage • How big of a sample would we need? • How accurate (narrow interval or small margin of error) would we like to be? • Suppose we wish to obtain a margin of error of 3% in a 95% CI for p. • That is, we want a proportion plus or minus 3%. • How many games would I have to or get to watch?
Sample Size Example #1: Home Court Advantage • Set up the equation • We need to guess p* • To be conservative, use .5 • Solve for n • Round up! Divide both sides by 1.96 Square both sides Multiply both sides by n Divide both sides by.000234
Sample Size Example #1: Home Court Advantage • Very cool! • I now have a statistical reason for watching 1069 college basketball games!
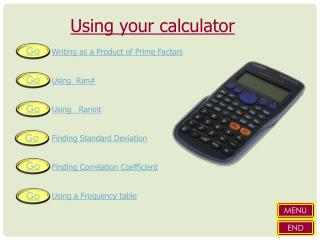
Choosing Sample Size and Using Your Calculator This concludes this presentation.