Download
1 / 9
90 likes | 115 Views
Sample size. Study Design. Cohort Study When do you use it? What do you select participants on? Continuous variable. Study Design. Cohort Study Continuous exposure Example Measure sbp levels and follow people to see if they have a stroke. Outcome Stroke yes or no. Study Design.

E N D
Study Design • Cohort Study • When do you use it? • What do you select participants on? • Continuous variable
Study Design • Cohort Study • Continuous exposure • Example • Measure sbp levels and follow people to see if they have a stroke. • Outcome • Stroke yes or no
Study Design • Exposure is exposure to disease. • Exposed group – women with GDM • Unexposed group – women without GDM • Outcome • Infant birth weight
Study Design • Cohort Study • Exposure to surgical procedure A • Exposure to surgical procedure B • What if clinic 1 only does A and clinic 2 only does B. • What is the unit of observation clinic or individual? • Is it valid to compare procedure A to B in a study with these two clinics? • What if clinic 1 and clinic 2 do both procedures? • Is it valid to compare procedure A to B in a study with these two clinics?
Study Design • Cohort Study versus Interventional Study • Cohort is only observational • A change in protocol or implementation of an intervention can be the exposure; however, if the intervention is implemented as part of the study then it is an interventional study not a cohort.
Study Design • Case – Control study • When do you use it? • What do you select participants on? • What are you measuring in this type of study? • Dichotomous exposure • Continuous exposure • What can you not estimate using this type of study design?
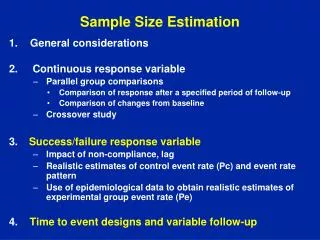
Sample size calculations • Outcome or exposure is continuous: comparing means in two groups • Effect size – Mean Difference • alpha=0.05, • Power = 80% • Need to have an estimate of what proportion of the subjects are in group 1. If this is a cross-sectional study you need to justify why you think you will have this proportion of people in group 1. • State the minimum effect size you want to be able to detect in words. • State the number of people required in each group to detect this effect size. • Do you think it is possible to get this many people.
Sample size calculations • Outcome and exposure are dichotomous • Effect size – Risk Ratio or difference in proportions • Alpha = 0.05 • Power = 80% • Need to have an estimate of what proportion of the subjects are in group 1. If this is a cross-sectional study you need to justify why you think you will have this proportion of people in group 1. For a cohort study the proportion in group 1 is the proportion of unexposed. For a case-control study the proportion in group 1 is the proportion of controls. • You need to have an estimate of the risk of disease in the unexposed for a cohort study. You need to have an estimate of the odds of exposure in the controls for a case-control study. In both cases, you need to justify where you are getting this number from. • You need to know what effect size you want to bet able to detect and why you have chosen this effect size. • Effect size: difference in proportions given the proportion in one group, risk ratio or odds ratio. • Assuming 11% of the unexposed (i.e., women without a lot of children) are diabetic we will be able to detect a difference if the risk of prevalent diabetes is 14.8% or greater in the exposed women (i.e., women with a lot of children). • The minimal detectable risk ratio for prevalent diabetes comparing women with greater than 3 children to women with 3 or fewer children in our data set is 1.35. • The minimal detectable odds ratio for prevalent diabetes comparing women with greater than 3 children to women with 3 or fewer children in our data set is 1.41. • Can determine this because OR= [P2 (1-P1)]/[(1-P2) P1] • Based on this the sample size program will calculate the n required. • Do you think it is possible to get this many people.