Download
1 / 24
240 likes | 434 Views
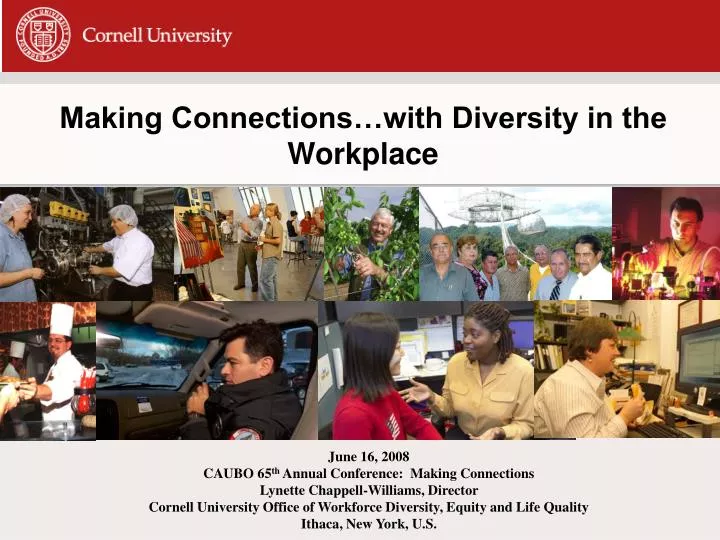
Making Connections…with Diversity in the Workplace. June 16, 2008 CAUBO 65 th Annual Conference: Making Connections Lynette Chappell-Williams, Director Cornell University Office of Workforce Diversity, Equity and Life Quality Ithaca, New York, U.S. Presentation Overview.

E N D
Making Connections…with Diversity in the Workplace June 16, 2008 CAUBO 65th Annual Conference: Making Connections Lynette Chappell-Williams, Director Cornell University Office of Workforce Diversity, Equity and Life Quality Ithaca, New York, U.S.
Presentation Overview • Overview of Cornell University • Race and Gender: “Traditional” Aspects of Diversity • Intersection between cultural diversity, sexual orientation, and religion • Managing the Four Generations in the Workforce • Business Needs vs. Family Responsibilities • Individuals with Disabilities “if even one [student of color] offered himself and passed the examinations, we should receive him even if all our five hundred students were to ask for dismissal on that account.” -Andrew Dickson White, 1874
Cornell University (Ithaca, New York, USA) Facts • Private University and Land Grant Institution for New York • Established in 1865 • Located in (rural) Upstate New York with locations in New York City and Doha, Qatar • 13,562 undergraduate students and 6,077 graduate students1 • Offers more than 70 formal major fields of study 1 Figures for fall 2006
University’s Vision Statement for Diversity and Inclusiveness January 2000
Race Demographics of Cornell University, Ithaca and Tompkins County in 2000 as Compared with Nation * Percentages exclude Bi/Multi-Race, Unreported, and Foreign Citizen categories.
Overview of Cornell’s “Traditional”Diversity/Inclusion Initiatives • Staff Designated to Handle Diversity Responsibilities • Cornell’s Affirmative Action Plan Incorporates Diversity, Inclusion and Work/Life • Sexual Harassment Prevention Posters in Different Languages • Programs to Increase Women and Individuals of Color in Skilled Trades • University Diversity Council: Executive Level and Working Group • Diversity Efforts in Local Community
Work/Life/Family Programming Supporting “Traditional” Diversity • “Sharing our World” Luncheons for Women and Minorities • “Life Cycles” Workshops • “MPN” Monthly Events • “Sandbox Socials” Events
LGBT Definitions • Sexual Orientation: attraction • Gender Identity: personal sense of male/female status • Gender Expression: physical manifestation of one’s identity
Cornell’s Diversity Focus on the LGBT Population • LGBT Resource Center • Safe Place Program • “Sharing Our World” Events • “Life Cycles” Workshops • Transgender Informational Web Page • Bias Program as Part of Discrimination Procedure
Safe Place Program • Safe Place promotes the creation of a space defined by equality, free from discrimination and hate. It is a public proclamation of support and affirmation of lesbian, gay, bisexual, transgender, and questioning members of our community. • Displaying a Safe Place card expresses the importance of speaking out against the marginalization of individuals through homophobia, heterosexism, and gender identity oppression.
Not on Our Campus,Not in Our Community • Cornell University’s Bias Response Program “Cornell University's commitment to diversity and inclusiveness necessarily implies that our community will include members who differ in their experiences, backgrounds, race and ethnicity, sex/gender, religious beliefs, sexual orientations, political persuasion, social perspectives, and other important respects.” -Bias Protocol, November 2000
Cornell University Bias Response Program • Bias Incident An act of bigotry, harassment, or intimidation that one could reasonably conclude is directed at a member or group of the Cornell community based on that individual’s or group’s actual or perceived: color, creed, disability, ethnicity, gender, gender identity/presentation, marital status, national origin, race, religion, sexual orientation, veteran status, or any combination of these or related factors, and when the identity of the alleged perpetrator is not known or is not reasonably identifiable, and when the action has occurred on Cornell’s campus or within an area that impacts the Cornell community. Cornell University’s Bias program includes all bias activity: • bias incidents as defined by the university; • bias/hate crimes, as defined by federal, state, and City of Ithaca laws; • and discrimination complaints as delineated by federal, state and local law.
Labor Force1 Indicators by Age Group, 2001 Counts for Canada, Provinces, and Territories - 20% Sample Data 1 Refers to persons who were either employed or unemployed during the week (Sunday to Saturday) prior to Census Day.
Multigenerational Facts • Traditionalists ( Born 1900-1945) • Make up approximately 75million of nation’s workforce • Work ethic shaped by Great Depression • “Make do or do without” • Baby Boomers (Born 1946 – 1964) • Comprise approximately 85 million of nation’s workforce • Typically respond to symbols of recognition: enhanced titles, money, perks, peer recognition • Tend to be competitive (due to size in workforce) • “Be anything you want to be”
Multigenerational Facts • Generation X (Born 1965-1980) • Comprise approximately 46 million of nation’s workforce • Focus on skills training, portability of benefits, and work/life balance (work is a means to an end and not the end, and it is to be fun) • “Why??” • Millenials/Generation Y (Born 1981-1999) • Presently at 75 million entering workforce • Focus on work that makes a difference or has value • Comfortable with technology and multitasking • “I am special”
Cornell’s Diversity Focus on Multigenerational Workforce • Flexibility Policy (Flex Schedule, Flex Place, Job Share) • Skills Training Opportunities • Connections with Retirees • “Salon Tours” Social Connections
Working Family Facts • In 1951, 24% of women in Canada were in the workforce; by 1999, the number had increased to 55% • Between 1976 and 1999, the number of Canadian women with children under 16 increased from 39% to 71% • Between 1975 and 1990, the number of employed women with children under 18 rose by 59% and the number of working women with children under age 6 increased by 80% (4.8 million to 8.7 million) • In 2006, of the 35.6 million families with children under 18, 90.5% had an employed parent, up by .3% from 2005 • In 2006, 51.6% of mothers with children younger than 1 year of age were in the labor force From: National Alliance of Caregivers, based on survey of 6,139 adults in 2003, U.S. Department of Labor, www.bls.gov/news.release/famee.nr0.htm, and 150 Canadian Statistics on Work, Family and Well-Being, 2001
Working Family Facts In 1996, 1.3 million women in Canada provided care to an elderly friend or family member In Canada, women represent 61% of the informal caregivers, and 2/3 of these women are in the paid workforce Currently, 21% of the U.S. adult population (44.4 million) are (unpaid) family caregivers in the U.S. Nearly 60% of U.S. caregivers work full or part time and nearly 40% of caregivers have children under the age of 18. 61% of the U.S.’s unpaid caregivers are women and 39% are men 58% of the US unpaid caregivers are between the ages of 18-49 and 42% are more than 50 years of age
Cornell’s Diversity Focus on Working Families • Flexibility Policy • Lactation “Policy” as Part of Time Away Policy • Lactation Spaces • “Life Cycles” Workshops • Financial Support for Child Care Expenses • “Universal” Restrooms • Dependent Care Consultant
U.S. People with Disabilities (PWD) Facts Based on Census Bureau 2000 Data • The U.S. Census Bureau estimates that there are over 54 million Americans with a disability--that's one in five, or 20 percent. From: http://www.accessiblesociety.org/topics/demographics-identity • According to the CDC report, the prevalence rate of disability was 24% among women and 20% among men. From: CDC's Morbidity and Mortality Weekly Report of February 23, 2001 / 50(07);120-5 at http://www.cdc.gov/mmwr/preview/mmwrhtml/mm5007a3
U.S. People with Disabilities (PWD) Facts Based on 2005 American Community Survey • Percentage of working age PWD: 38.1% • Percentage of working age individuals reporting a disability: 12/6% • Percentage of working age PWD working full time: 22.6% • Percentage of working age PWD who were 21-29 years of age: 10.9% • Percentage of working age PWD were individuals of color: 26.4% • Percentage of working age PWD who werewomen: 51.6% From: Houtenville, A. J. (2006, October). 2005 Disability Status Reports: United States. Rehabilitation Research and Training Center on Disability Demographics and Statistics, Ithaca, NY: Cornell University. http://digitalcommons.ilr.cornell.edu/edicollect/1236
Cornell’s Diversity Focus on People with Disabilities • Disability Accommodation Process • Disability Information Page: http://www.cornell.edu/disability/ • Cross-Department Senior Level and “Working Group” Disability Task Forces • “Life Cycles” Workshops • Development of Disability Strategic Plan Based on Diversity Model • Online Accessible Parking and Building Maps
Thank you! Thank you for attending the presentation and have a safe trip home!