Download
1 / 21
250 likes | 896 Views
Exchange of Gases in the Lungs. Week 3 Dr. Walid Daoud A. Professor. Diffusion of Gases through respiratory membrane. Layers of the respiratory membrane: 1- Fluid lining alveoli containing surfactant. 2- One layer of alveolar epithelium. 3- Basement membrane of alveolar epithelium.

E N D
Exchange of Gases in the Lungs Week 3 Dr. Walid Daoud A. Professor
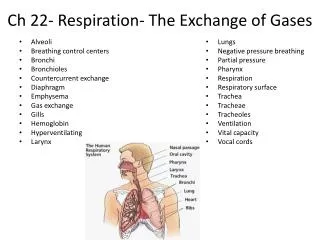
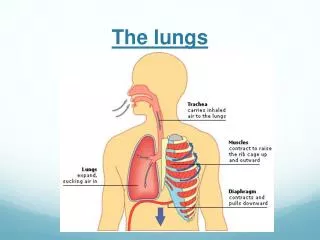
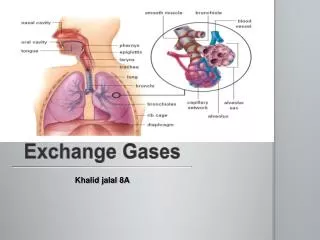
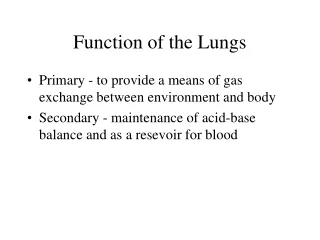
Diffusion of Gases through respiratory membrane Layers of the respiratory membrane: 1- Fluid lining alveoli containing surfactant. 2- One layer of alveolar epithelium. 3- Basement membrane of alveolar epithelium. 4- Interstitial space. 5- Basement membrane of capillary. 6- Endothelial cells of capillary.
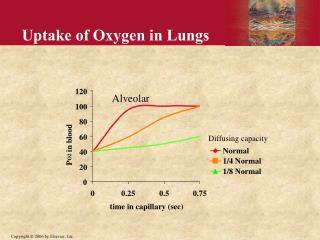
Gas Exchange Normal adult lungs contain 300 million alveoli. Respiratory membrane: - Thickness 0.2 microns. - Surface area 100 square meter. Blood traverse pulmonary capillary in 0.75 sec. At rest only 0.25 sec for equilibrium between Alveolar and capillary PO2.
Factors affecting rate of diffusion through respiratory membrane Rate of diffusion is directly proportional to: 1- Pressure gradient across the membrane. 2- Surface area of respiratory membrane. 3- Temperature. 4- Solubility of the gas in the medium.
Factors affecting rate of diffusion through respiratory membrane Rate of diffusion is inversely proportional to: 1- Square root of molecular weight. 2- Thickness of the membrane. It increases with edema and lung fibrosis.
Oxygen Transport by Blood 1- O2 in physical solution: 0.3 ml O2 in 100 ml arterial blood 0.13 ml O2 in 100 ml venous blood 0.17 ml transported to tissues by 100 ml plasma O2 in physical solution determines the PO2 in blood and the direction of diffusion of O2.
Oxygen Transport by Blood 2- O2 carried by Hb: 19.5 ml O2 in 100 ml arterial blood 98% of O2 is transported in loose chemical combination with Hb Hemoglobin moleculecontains 4 ferrous atoms, each reversibly combines with one O2 molecule.
O2 Contents It is the volume of O2 carried by blood combined with Hb / 100 ml blood. O2 contents depends on: 1-Amount of Hb present. 2- O2 tension. 3- O2 affinity of Hb. 4- Metabolic state of the organ.
O2 Capacity of Blood It is the maximum volume of O2 that can be carried by Hb when Hb is fully saturated with O2. 1 gram Hb combines with 1.34 ml O2. O2 capacity = 1.34 ml O2 x 15 gm = 20.1 ml O2 / 100 ml blood O2 capacity varies with Hb content.
Hemoglobin Saturation with O2 % Saturation of Hb with O2: % HbO2 = O2 content x 100 O2 capacity % Hb saturation does not vary with Hb content because both O2 content and capacity are affected to the same extent.
Hb O2 Dissociation Curve It is the relationship between PaO2 and % HbO2. It is not linear (S-shaped). -O2 bound to Hb is relatively constant in PaO2 above 70 mmHg (flat part of the curve). -At lower Pao2 levels large change in volume of O2 bound to Hb (steep part of the curve).
Physiological significance of S-shaped oxy-Hb dissociation curve - At the flat portion of the curve, Alveolar and arterial PO2 can decrease to 60 mmHg with little change in % saturation (90%) e.g, at high altitude. - Below PO2 60 mmHg (steep part of the curve) desaturation of Hb is rapid and O2 is readily given off to tissues with little further fall in PO2.
Physiological significance of S-shaped oxy-Hb dissociation curve - At 40 mmHg O2 tension (tissues during rest and venous blood), blood is 70% saturated, sao tissues take 27% of O2 of arterial blood. - Below 40 mmHg (tissues during muscular exercise). The curve becomes more or less vertical (steep) enable tissue to extract relatively large amount of O2fro blood with relatively small change in PaO2.
Shift of O2 Hb dissociation curve to the right - Increase temperature. - Increase PCO2. - Decrease pH. - Increase 2,3-diphosphoglycerate (2,3-DPG) This occurs during muscular exercise Decrease affinity of Hb to O2. O2 is given easily to tissues
Shift of O2 Hb dissociation curve to the left - Decrease temperature. - Decrease PCO2. - Increase pH. - Carbon monoxide (CO) poisoning Increase affinity of Hb to O2 Hb gives its O2 with difficulty to tissues
CO2 Transport by Blood 100 ml of arterial blood contain 48 ml CO2 100 ml of venous blood contain 52 ml CO2 1- CO2 in blood in physical solution (3 ml) Responsible for PO2 in blood (PaCO2 40 mmHg). 2- CO2 ion blood in chemical; combination As bicarbonaters (42 ml) As Carbamino compounds (3 ml)
Tidal CO2 It is CO2 given by tissues to 100 ml blood. At rest tidal CO2 = 52 – 48 = 4 ml/100 ml. It is mainly carried in chemical combination with Hb which buffer tidal CO2, so pH of blood does not markedly change.
Transport of Tidal CO2 1- In physical solution (0.4 ml) 2- As bicarbonate (2.6 ml) 3- As carbamino compounds (1 ml)
Transport of Tidal CO2 Chloride Shift or Hamburger Phenomenon