Download
1 / 1
10 likes | 93 Views
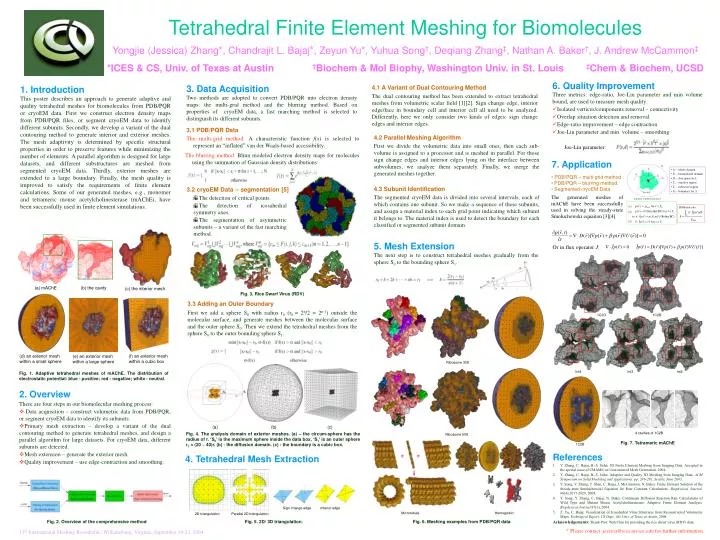
Diffusion rate:. Or in flux operator J :. (1) (2) (3). (a) mAChE. (b) the cavity. (c) the interior mesh. 1C2O. 1C2B. (d) an exterior mesh within a small sphere. (f) an exterior mesh within a cubic box. (e) an exterior mesh within a large sphere. Ribosome 30S. Int4. Int3. Int2.

E N D
Diffusion rate: Or in flux operator J: (1) (2) (3) (a) mAChE (b) the cavity (c) the interior mesh 1C2O 1C2B (d) an exterior mesh within a small sphere (f) an exterior mesh within a cubic box (e) an exterior mesh within a large sphere Ribosome 30S Int4 Int3 Int2 Ribosome 50S 4 cavities of 1C2B (a) (b) (c) Sign change edge Interior edge Microtubule Hemoglobin 2D triangulation Parallel 2D triangulation Tetrahedral Finite Element Meshing for Biomolecules Yongjie (Jessica) Zhang*, Chandrajit L. Bajaj*, Zeyun Yu*, Yuhua Song†, Deqiang Zhang‡, Nathan A. Baker†, J. Andrew McCammon‡ *ICES & CS, Univ. of Texas at Austin †Biochem & Mol Biophy, Washington Univ. in St. Louis ‡Chem & Biochem, UCSD 6. Quality Improvement 3. Data Acquisition Two methods are adopted to convert PDB/PQR into electron density maps: the multi-grid method and the blurring method. Based on properties of cryoEM data, a fast marching method is selected to distinguish its different subunits. 1. Introduction This poster describes an approach to generate adaptive and quality tetrahedral meshes for biomolecules from PDB/PQR or cryoEM data. First we construct electron density maps from PDB/PQR files, or segment cryoEM data to identify different subunits. Secondly, we develop a variant of the dual contouring method to generate interior and exterior meshes. The mesh adaptivity is determined by specific structural properties in order to preserve features while minimizing the number of elements. A parallel algorithm is designed for large datasets, and different substructures are meshed from segmented cryoEM data. Thirdly, exterior meshes are extended to a large boundary. Finally, the mesh quality is improved to satisfy the requirements of finite element calculations. Some of our generated meshes, e.g., monomer and tetrameric mouse acetylcholinesterase (mAChE), have been successfully used in finite element simulations. 4.1 A Variant of Dual Contouring Method The dual contouring method has been extended to extract tetrahedral meshes from volumetric scalar field [1][2]. Sign change edge, interior edge/face in boundary cell and interior cell all need to be analyzed. Differently, here we only consider two kinds of edges: sign change edges and interior edges. • Three metrics: edge-ratio, Joe-Liu parameter and min volume bound, are used to measure mesh quality. • Isolated vertices/components removal – connectivity • Overlap situation detection and removal • Edge-ratio improvement – edge contraction • Joe-Liu parameter and min volume – smoothing 3.1 PDB/PQR Data The multi-grid method: A characteristic function f(x) is selected to represent an “inflated” van der Waals-based accessibility. 4.2 Parallel Meshing Algorithm First we divide the volumetric data into small ones, then each sub-volume is assigned to a processor and is meshed in parallel. For those sign change edges and interior edges lying on the interface between subvolumes, we analyze them separately. Finally, we merge the generated meshes together. Joe-Liu parameter: The blurring method: Blinn modeled electron density maps for molecules using the summation of Gaussian density distributions: 7. Application • -- whole domain • -- biomolecule domain • -- free space in • a – reactive region • r – reflective region • b – boundary for • PDB/PQR – multi-grid method • PDB/PQR – blurring method • Segmented cryoEM Data • The generated meshes of mAChE have been successfully used in solving the steady-state Smoluchowski equaiton [3][4]. 4.3 Subunit Identification The segmented cryoEM data is divided into several intervals, each of which contains one subunit. So we make a sequence of these subunits, and assign a material index to each grid point indicating which subunit it belongs to. The material index is used to detect the boundary for each classified or segmented subunit domain. • 3.2 cryoEM Data – segmentation [5] • The detection of critical points. • The detection of icosahedral symmetry axes. • The segmentation of asymmetric subunits – a variant of the fast marching method. Schematic of problem domain [3] 5. Mesh Extension The next step is to construct tetrahedral meshes gradually from the sphere S0 to the bounding sphere S1. Fig. 3. Rice Dwarf Virus (RDV) 3.3 Adding an Outer Boundary Firstwe add a sphere S0 with radius r0 (r0 = 2n/2 = 2n-1) outside the molecular surface, and generate meshes between the molecular surface and the outer sphere S0. Then we extend the tetrahedral meshes from the sphere S0 to the outer bounding sphere S1. (3) Fig. 1. Adaptive tetrahedral meshes of mAChE. The distribution of electrostatic potential: blue - positive; red - negative; white - neutral. • 2. Overview • There are four steps in our biomolecular meshing process: • Data acquisition – construct volumetric data from PDB/PQR, or segment cryoEM data to identify its subunits. • Primary mesh extraction – develop a variant of the dual contouring method to generate tetrahedral meshes, and design a parallel algorithm for large datasets. For cryoEM data, different subunits are detected. • Mesh extension – generate the exterior mesh. • Quality improvement – use edge-contraction and smoothing. Fig. 4. The analysis domain of exterior meshes. (a) – the circum-sphere has the radius of r. ‘S0’ is the maximum sphere inside the data box, ‘S1’ is an outer sphere r1 = (20 ~ 40)r. (b) - the diffusion domain. (c) - the boundary is a cubic box. Fig. 7. Tetrameric mAChE 1C2B • References • Y. Zhang, C. Bajaj, B.-S. Sohn. 3D Finite Element Meshing from Imaging Data. Accepted in the special issue of CMAME on Unstructured Mesh Generation. 2004. • Y. Zhang, C. Bajaj, B.-S. Sohn. Adaptive and Quality 3D Meshing from Imaging Data, ACM Symposium on Solid Modeling and Applications. pp. 286-291, Seattle, June 2003. • Y. Song, Y. Zhang, T. Shen, C. Bajaj, J. McCammon, N. Baker. Finite Element Solution of the Steady-state Smoluchowski Equation for Rate Constant Calculations. Biophysical Journal, 86(4):2017-2029, 2004. • Y. Song, Y. Zhang, C. Bajaj, N. Baker. Continuum Diffusion Reaction Rate Calculations of Wild Type and Mutant Mouse Acetylcholinesterase: Adaptive Finite Element Analysis. Biophysical Journal 87(3), 2004. • Z. Yu, C. Bajaj. Visualization of Icosahedral Virus Structures from Reconstructed Volumetric Maps. Techniqical Report, CS Dept., the Univ. of Texas at Austin, 2004. • Acknowledgements: Thank Prof. Wah Chiu for providing the rice dwarf virus (RDV) data. 4. Tetrahedral Mesh Extraction Fig. 2. Overview of the comprehensive method Fig. 5. 2D/ 3D triangulation. Fig. 6. Meshing examples from PDB/PQR data * Please contact jessica@ices.utexas.edu for further information. 13th International Meshing Roundtable, Williamsburg, Virginia, September 19-22, 2004