Download
1 / 40
400 likes | 405 Views
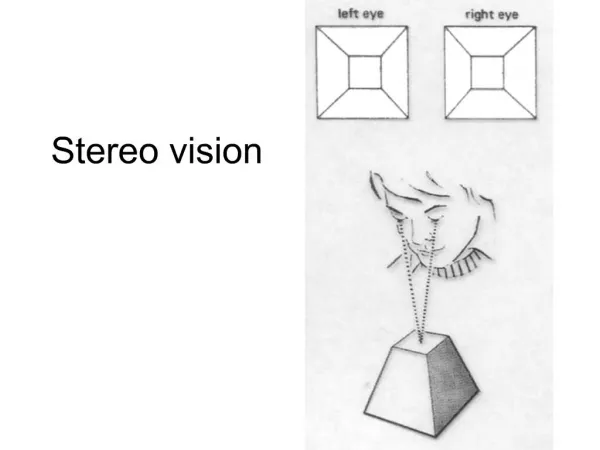
3D GRAPHICAL MODELING OF VEGETABLE SEEDLINGS BASED ON A STEREO MACHINE VISION SYSTEM. Ta-Te Lin, Wen-Chi Liao, Chung-Fan Chien Department of Bio-Industrial Mechatronics Engineering, National Taiwan University, Taipei, Taiwan, ROC. INTRODUCTION. Plant models Visualization of plant models

E N D
3D GRAPHICAL MODELING OF VEGETABLE SEEDLINGSBASED ON A STEREO MACHINE VISION SYSTEM Ta-Te Lin, Wen-Chi Liao, Chung-Fan Chien Department of Bio-Industrial Mechatronics Engineering, National Taiwan University, Taipei, Taiwan, ROC
INTRODUCTION • Plant models • Visualization of plant models • Digitizing methods • L-system for plant structure modeling • Model-based growth measurement
MATERIALS & METHODS • Stereo Machine Vision System • L-System Formulation • Graphical Modules • Test of Method Accuracy • Model-based growth measurement
Start Automatic Search for Positions and Orientation of Leaves Initialization and Calibration of the System Manual Correction and Supplement of Searched Results Stereo Image Acquisition and Image Registration Conversion of Parameters and Creation of L-System Strings Image Segmentation Computer Graphical Simulation and Calculation of Plant Features End 3D GRAPHICAL SIMULATION FLOW CHART
Image processing board Rotary stage RS-232 interface STEREO MACHINE VISION SYSTEM Color CCD camera Stepper motor controller Rotarystage
3D GRAPHICAL SIMULATION BASIC PLANT MODULES ROOT: R(Xr, Yr, Zr) INTERNODE: I(Aix, Aiy, Li, Di) LEAF: L(Apx, Apy, Lp, Alx, Aly, Wl, Ll, Nl)
3D GRAPHICAL SIMULATION BASIC PLANT MODULES ROOT: R(Xr, Yr, Zr)
3D GRAPHICAL SIMULATION BASIC PLANT MODULES INTERNODE: I(Aix, Aiy, Li, Di)
3D GRAPHICAL SIMULATION BASIC PLANT MODULES INTERNODE: I(Aix, Aiy, Li, Di)
3D GRAPHICAL SIMULATION BASIC PLANT MODULES INTERNODE: I(Aix, Aiy, Li, Di)
3D GRAPHICAL SIMULATION BASIC PLANT MODULES INTERNODE: I(Aix, Aiy, Li, Di)
3D GRAPHICAL SIMULATION BASIC PLANT MODULES LEAF: L(Apx, Apy, Lp, Alx, Aly, Wl, Ll, Nl)
3D GRAPHICAL SIMULATION BASIC PLANT MODULES LEAF: L(Apx, Apy, Lp, Alx, Aly, Wl, Ll, Nl)
3D GRAPHICAL SIMULATION BASIC PLANT MODULES LEAF: L(Apx, Apy, Lp, Alx, Aly, Wl, Ll, Nl)
3D GRAPHICAL SIMULATION BASIC PLANT MODULES LEAF: L(Apx, Apy, Lp, Alx, Aly, Wl, Ll, Nl)
3D GRAPHICAL SIMULATION BASIC PLANT MODULES LEAF: L(Apx, Apy, Lp, Alx, Aly, Wl, Ll, Nl)
3D GRAPHICAL SIMULATION BASIC PLANT MODULES LEAF: L(Apx, Apy, Lp, Alx, Aly, Wl, Ll, Nl)
3D GRAPHICAL SIMULATION BASIC PLANT MODULES LEAF: L(Apx, Apy, Lp, Alx, Aly, Wl, Ll, Nl)
3D GRAPHICAL SIMULATION BASIC PLANT MODULES LEAF: L(Apx, Apy, Lp, Alx, Aly, Wl, Ll, Nl)
3D GRAPHICAL SIMULATION L-SYSTEM R(260,70,204) I(-11.7,323.1,49.0,3) L(-40.9,284.0,0,50.3,-17.2,53.1,53.1,1) L(-50.5,74.0,0,75.4,-9.7,48.3,48.3,2) L(-38.7,355.2,0,76.9,-35.7,112.2,112.2,3) L(-20.5,194.0,0,70.4,-28.8,107.5,107.5,4)
Digitizing Process Conversion and Calculation of L-system Parameters Translation L-system Strings Interpretation Calculation of Dimension and Spatial Coordinates of Plant Modules Creation of Plant Modules and Graphical Simulation 3D GRAPHICAL SIMULATION L-SYSTEM STRINGS
3D GRAPHICAL SIMULATION MAKING TEXTURAL IMAGE TEMPLATE
Elliptical Surface Approach Bezier Surface Approach 3D GRAPHICAL SIMULATION LEAF MODULE
Real Image Graphical Simulation Side View Top View 3D GRAPHICAL SIMULATION PEPPER SEEDLING
3D GRAPHICAL SIMULATION OTHER PLANTS
3D GRAPHICAL SIMULATION OTHER PLANTS
Semi-Automatic Measurement Point, Length, Angle, Texture L-system 3D Computer Graphics Seedling Features By Model Computation Automatic Measured MODEL-BASED MEASUREMENT
MODEL-BASED MEASUREMENT SEEDLING FEATURES • Stem length • Height • Span • Total leaf area and individual leaf area • Top fresh weight (need calibration) • Top dry weight (need calibration) • Number of leaves • Leaf area index, LAI • Leaf length • Leaf width
Comparisons of predicted plant height with manually measured plant height. Pepper
Comparisons of predicted plant height with manually measured plant height for four different types of vegetable seedlings. Pepper Collard Cabbage Chinese cabbage
Comparisons of predicted plant total leaf area with manually measured plant total leaf area for four different types of vegetable seedlings. Pepper Collard Cabbage Chinese cabbage
Slope a Slope a Intercept b Intercept b R2 R2 RMSE RMSE RRMSE RRMSE First internode First internode 0.90 0.98 1.2 0.43 0.97 0.94 0.91 mm 0.61 mm 8.9% 2.4% Plant height Plant height 1.06 0.97 1.2 -1.43 0.98 0.96 1.65 mm 1.73 mm 10.8% 4.3% Leaf length Leaf length 1.06 0.85 -4.2 0.95 0.91 0.87 4.84 mm 3.96 mm 21.1% 15.6% Leaf width Leaf width 1.01 1.12 -2.46 0.32 0.92 0.92 1.49 mm 2.58 mm 16.1% 12.9% Individual leaf area Individual leaf area 1.03 0.99 -0.08 0.05 0.96 0.94 0.72 cm2 0.41 cm2 29.5% 17.0% Total leaf area Total leaf area 1.05 0.98 -0.14 -0.05 0.98 0.95 1.42 cm2 1.13 cm2 10.2% 9.8% Petiole length Petiole length 0.99 0.96 2.7 2.7 0.84 0.93 3.61 mm 4.39 mm 57.2% 27.1% Comparisons of predicted and manually measured plant features. Pepper Collard
Slope a Slope a Intercept b Intercept b R2 R2 RMSE RMSE RRMSE RRMSE First internode First internode 0.98 1.04 -0.47 0.20 0.99 0.98 0.46 mm 0.42 mm 4.1% 4.6% Plant height Plant height 0.99 0.96 0.75 0.64 0.96 0.98 1.58 mm 1.26 mm 8.1% 7.6% Leaf length Leaf length 0.93 0.89 0.90 -0.77 0.95 0.94 3.91 mm 4.17 mm 18.2% 16.6% Leaf width Leaf width 0.99 1.16 -4.00 -0.79 0.89 0.85 3.52 mm 2.98 mm 21.4% 15.5% Individual leaf area Individual leaf area 1.01 0.98 -0.18 -2.20 0.92 0.94 1.03 cm2 0.95 cm2 30.6% 23.0% Total leaf area Total leaf area 1.02 0.85 1.96 0.62 0.98 0.89 1.55 cm2 3.14 cm2 15.6% 12.7% Petiole length Petiole length 0.95 0.97 3.20 3.80 0.92 0.87 5.47 mm 4.78 mm 36.3% 30.7% Comparisons of predicted and manually measured plant features. Cabbage Chinese cabbage
Growth curves of total leaf area for a batch of pepper seedlings showing the variability within the batch.
Growth curves of total leaf area for pepper seedlings cultured in pots of different sizes.
Average growth curves of leaf area for individual leaves of pepper seedlings cultured in pots of 180 ml volume.
Average growth curves of leaf area for the 1st leaf of pepper seedlings cultured in pots of different sizes.
CONCLUSIONS • A graphical model based on L-system was developed to represent vegetable seedling structures. • The structural model was implemented for efficient graphical simulation of various vegetable seedlings. • The basic geometric and textural information for vegetable seedlings were successfully digitized by a stereo machine vision system.
CONCLUSIONS • Measurements of four different seedlings were performed to assess the methodology. The system was successfully applied in measuring growth curves of pepper seedlings under different culture conditions. • The model-based measurement of plant features offers additional information than what conventional methods can provide.
THANK YOU 謝 謝