Download
1 / 4
40 likes | 150 Views
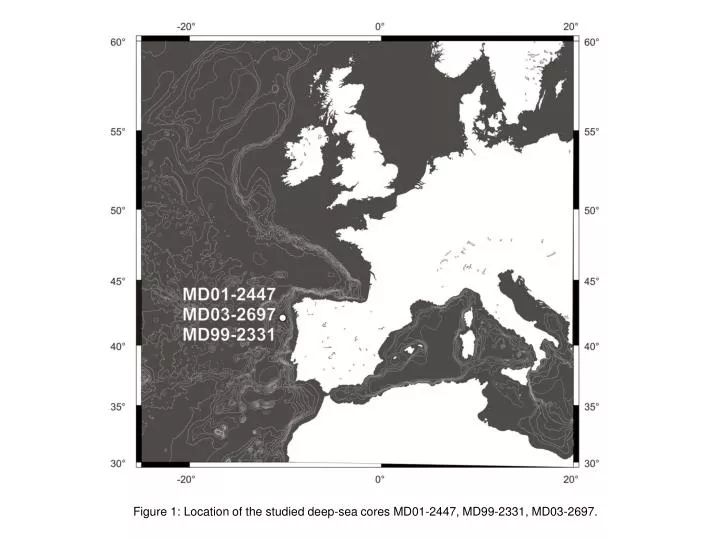
Figure 1: Location of the studied deep-sea cores MD01-2447, MD99-2331, MD03-2697. Figure 2: Lightness record of the three Iberian margin deep-sea cores.

E N D
Figure 1: Location of the studied deep-sea cores MD01-2447, MD99-2331, MD03-2697.
Figure 2: Lightness record of the three Iberian margin deep-sea cores. Pollen analysis has been performed in the intervals represented by grey areas. Hatched area corresponds to the disturbed interval in core MD01-2447.
Figure 3: Direct correlation of continental and marine proxies from Iberian margin deep-sea cores. From the left to the right: 1) Synthetic pollen diagram 2) Percentages of warm planktic foraminifera (only for MIS 7, 9 and 11) and Neogloboquadrina pachyderma left coiling 3) Planktic d18O curve 4) Benthic d18O curves. For the last 25,000 years, the benthic isotopic data of core MD99-2331 being not available, we present those of core MD01-2447. The correlation between both cores has been performed using different marine proxies (lightness, CaCO3 content, abundance and coiling ratio of Globorotalia hirsuta and G. truncatulinoides and percentages of N. pachyderma s.) (Desprat, 2005) 5) June insolation at 65°N. Blue areas indicate cold periods
Table1: Major warm periods detected in north-western Iberia during the last 425,000 years versus marine isotopic stratigraphy. The time lags between the boundaries of isotopic substages and stages and those of forested phases are not indicated in this table.