Download
1 / 31
310 likes | 409 Views
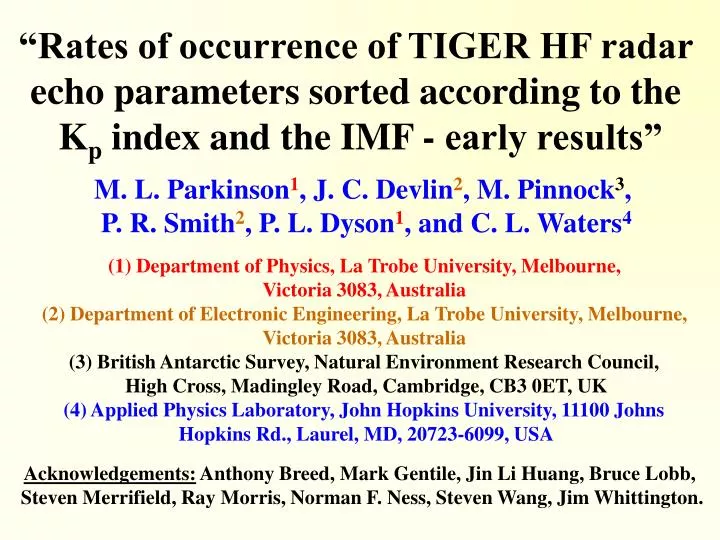
“Rates of occurrence of TIGER HF radar echo parameters sorted according to the K p index and the IMF - early results”. M. L. Parkinson 1 , J. C. Devlin 2 , M. Pinnock 3 , P. R. Smith 2 , P. L. Dyson 1 , and C. L. Waters 4 (1) Department of Physics, La Trobe University, Melbourne,

E N D
“Rates of occurrence of TIGER HF radar echo parameters sorted according to the Kp index and the IMF - early results” M. L. Parkinson1, J. C. Devlin2, M. Pinnock3, P. R. Smith2, P. L. Dyson1, and C. L. Waters4 (1) Department of Physics, La Trobe University, Melbourne, Victoria 3083, Australia (2) Department of Electronic Engineering, La Trobe University, Melbourne, Victoria 3083, Australia (3) British Antarctic Survey, Natural Environment Research Council, High Cross, Madingley Road, Cambridge, CB3 0ET, UK (4) Applied Physics Laboratory, John Hopkins University, 11100 Johns Hopkins Rd., Laurel, MD, 20723-6099, USA Acknowledgements: Anthony Breed, Mark Gentile, Jin Li Huang, Bruce Lobb, Steven Merrifield, Ray Morris, Norman F. Ness, Steven Wang, Jim Whittington.
The Tasmanian Tiger is alive! Why Compile TIGER Echo Statistics? • The operational capability of the radar needs to be defined to help in the design of new experiments. • Geographically, TIGER is the most equatorward of any of the SuperDARN radars (43.4°S, 147.2°E), yet it still scans the high geomagnetic latitude region (~57°S to 88°S). • The statistical approach is [one of] the best ways to characterise the FITACF parameters and new pheno-mena discovered with any instrument.
What Factors Condition the Observed Distributions of TIGER echoes? (1) The Design and Operation of the Radar: The power transmitted and the effective gain of the radar. The radiation distribution patterns. The chosen operating frequencies. (2) Radio Propagation Effects: The morphology of the ionospheric layers and the propagation modes they support. Convergence and divergence of the radio waves. Nondeviative ionospheric absorption (diurnal, seasonal, and sunspot cycle variations). TIGER TX Box
(3) Irregularity Generation Mechanisms: Decameter-scale ionospheric irregularities are thought to be generated by instability processes acting in the pres-ence of gradients in electron density. These gradients might be controlled by: The degree of insolation*** Particle precipitation** Atmospheric gravity waves ULF wave activity Spatio-temporal variations in the large-scale convection* Spatio-temporal variations in neutral atmospheric species Convection vortices driven by field-aligned currents
The DataBase & Analysis: • All the “normal_scan_nodata” and “normal_scan3” data recorded on TIGER beam #4 during the austral summer interval December, 1999 to February, 2000. • Kp indices from NGDC and ACE Level 2 interplanetary magnetic field (IMF) data. • FITACF and XCF parameters were compiled for 31,468 separate beam #4 soundings evenly distributed in magnetic local time (MLT). • The ACF/XCF parameters were sorted into 15-min bins in MLT, 75 default range bins, and the six Kp categories: all, 0–1, >1–2, >2–3, >3–4, 4, and the four basic IMF categories in the By–Bz plane.
Why TIGER Beam #4? Beam #4 CGM Pole
Jan. Feb. Dec. Day 001 = 1999 Jan. 01
R e s t r i c t e d !!
BPS/CPS? Plasmapause?
BPS/CPS? Plasmapause?
Summary • Most echoes detected by TIGER were caused by back-scatter from the Southern Ocean via the sky-wave mode (~65%). • Most of the ionospheric echoes were caused by back-scatter from irregularities in the austral auroral oval, via the half- and 1.5-hop sky-wave modes (~32%). • The ionospheric echoes mostly occurred on the night-side, with the peak occurrence (~70%) just beyond magnetic midnight. This peak moved equatorward with increasing Kp index, but the occurrence rate decreased dramatically with Kp, probably due to enhanced absorption.
Maximum los velocities (~ –400 m s-1) were associated with the pre-noon cusp/cleft region. The cross polar cap jet was well defined, with a sharp decrease in los velocity on the nightside at ~67°S. • Maximum spectral widths (~500 m s-1) were associated with the pre-noon cusp/cleft region. There was also a sharp decrease in spectral width on the nightside at ~67°S. • The sharp decrease in los velocity and spectral width on the nightside may be related to signatures of the bound-ary plasma sheet, plasmapause, and main ionospheric trough measured by other instruments. • E-region scatter peaked at about 5 h MLT ???
Jan. Feb. Dec.
Summary • Most echoes detected by TIGER were caused by back-scatter from the Southern Ocean via the sky-wave mode (~65%), but also via the surface-wave mode (<1.5%)? • Most of the ionospheric echoes were caused by back-scatter from irregularities in the austral auroral oval, via the half- and 1.5-hop sky-wave modes (~32%), but there was also evidence for “direct los echoes” (<2.5%)? • The ionospheric echoes mostly occurred on the night-side, with a peak occurrence (~70%) just beyond magnet-ic midnight. The peak occurrence moves equatorward and to later MLT with increasing Kp index. The best coverage in MLT and range was achieved for Kp in the range ~2+ to 3.
Maximum los velocities (~ –400 m s-1) were associated with the pre-noon cusp/cleft region. The cross polar cap jet was well defined, with a sharp decrease in los velocity on the nightside at ~67°S. Plasmapause signature? • Maximum spectral widths (~500 m s-1) were associated with the pre-noon cusp/cleft region region. Again, there was a sharp decrease in spectral width on the nightside at ~67°S. Plasmapause signature? • E-region scatter peaked at about 5 h MLT ??? • The average amplitudes of ionospheric echoes decreased with range-2. • The elevation angles of sea echoes were mostly in the range 20 to 26°.