Download
1 / 69
690 likes | 713 Views
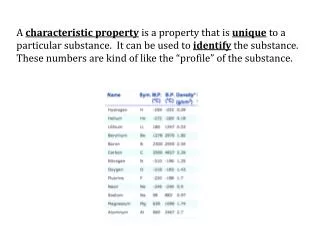
INSTRUMENTATION CHARACTERISTIC. WHAT IS INSTRUMENTATION. is a collection of Instruments and their application for the purpose of Observation, Measurement and Control. Reference: ISA std. S 51.1 The key word is Observation or measurement control. Instrumentation. Cold water in. process.

E N D
WHAT IS INSTRUMENTATION • is a collection of Instruments and their application for the purpose of Observation, Measurement and Control. Reference: ISA std. S 51.1 • The key word is • Observation or measurement • control
Instrumentation Cold water in process steam in hot water out 3-15psi TT Set point I/P TIC 4-20 mA 4-20 mA Instrumentation Process Control Priyatmadi 2008 3
What is sensor • Def. 1. (Oxford dictionary) • A device giving a signal for the detection or measurement of a physical property to which it responds. • Def. 2. • A sensor is a device that receives a signal or stimulus and response with an electrical signal. Electrical mechanical Magnetic Chemical Optical Radiation Thermal
Passive and active sensors • Passive sensors are sensors which do not provide energy to sense, they just absorb the energy form the measurand and convert it to electrical signal, e.g. pressure gauge, thermocouple • Active sensors are sensors which provide energy in measurement process , e.g. radar
Sensor properties Measurements Heisenberg (1927): ”The momentum and position of a particle can not both be precisely determined at the same time.” Measuring activity disturbs the physical process (loading effect), produce error Measurement error: That is the difference between the measured value and the true value. error = measured value - true value Deterministic errors: They are repeated at every measurement, e.g. reading offset or bias. Such errors can be reduced by proper calibration. Random errors: They are caused by several parameters and change in time in an unpredictable fashion. They can be quantified by mean errors, standard Deviation. Can be reduce by averaging several measurements
Sensor properties output ideal factual input Ideally, the sensor characteristic is a straight line should take no time convert the input. But that is never the case.
SENSOR CHARACTERISTIC Accuracy : Error measurement Sensitivity: change in output for unit change in input Resolution: the smallest change in the signal that can be detected and accurately indicated by a sensor. Linearity: the closeness of the calibration curve to a straight line. Drift: the deviation from the null reading of the sensor when the value is kept constant for a long time.
SENSOR CHARACTERISTIC Hysteresis: the indicated value depends on direction of the test (increasing and decreasing) Repeatability (precision): the maximum deviation from the average of repeated measurements of the same static variable. DynamicCharacteristics: A sensor may have some transient characteristic. The sensor can be tested by a step response where the sensor output is recorded for a sudden change of the physical variable. The rise time, delay time, peak time, settling time, percentage overshoot should be as small as possible.
Accuracy • Accuracy is a degree of conformity of an indicated value to recognized accepted standard value or ideal value • Measured accuracy is the maximum positive and negative deviation observed during a testing a device under specified condition and procedure. • Accuracy rating is a number or quantity that defines a limit that error will not exceed when the device is used under specific condition. • When the operating conditions are not specified reference operating condition should be assumed. • In specification sheet term accuracy should be assumed to mean accuracy rating. • Accuracy rating includes the combines effect of conformity, hysteresis, dead band, and repeatability.
Accuracy output downscale calibration Specified characteristic Low permissible error limit Accuracy, rating Upscale calibration Max actual negative deviation Max actual negative deviation Low permissible error limit 0 Input 100%
Accuracy, rating Accuracy rating can be expressed in number of form, e.g.: • In term of measured variable e.g.: ±2o C • In percent of span e.g.: ±0.5% of span • In percent of upper range e.g.: ±0.5% of upper range • In percent of scale length e.g.: ±0.5% of scale length • In percent of output reading e.g.: ±0.5% of output 110 -10 Range -10 to 110, upper range 110, lower range -10 Span = length = 120
Measuring Accuracy Create calibration table by • Set 50% input (the input must be secondary standard source) • Read the output • Compute the percentage deviation and write it down in the table • Repeatedly increase the input until 100% is reach then decrease until 0%, increase and decrease again and again.
Measured Accuracy Measured accuracy is the greatest positive and negative deviation of the recorded values. Measured accuracy is -0.32% to +0.26%
Dead band. Dead band is the range through which an input can be varied without initiating observable response. Dead band is usually expressed in percent of span Dead band
Dead band. To measure dead band proceed as follows: • Slowly increase the input until a detectable output change is observed • Observe the input value • Slowly decrease the input until a detectable output change is observed • Observe the input value The difference between step 2 and 4 is the dead band. Those steps is repeated for input from 0% to 100%. The highest number is reported Example: the dead band is 0.10% of the input span
Drift, Point Drift is change of input-output relation over a period of time Point drift is the maximum change in recorded output during the test period, expressed in percent of output span. Example: The point drift is 0.1% of output span for 24 hour test To measure drift proceed as follows: • Adjust the input to the desired values without overshoot and record the output value. The test device should be permitted to warm up before recording the initial output value. • Maintain a fixed input value and fixed operating condition for the duration of the test. • Record the output value during the test.
Hysteresis A property of element evidenced by the dependence of the output value for the given excursion of input, upon the history of prior excursions and the current direction of the traverse. output Hysteresis input
output output Hysteresis input input output Dead band Hysteresis + dead band input Hysteresis + dead band
Hysteresis • Hysteresis is usually determined by subtracting the value of dead band from the maximum separation between upscale going and down scale going indication of calibration report. • This measurement is sometimes called hysteresis error or hysteretic error
Hysteresis Hysteresis + dead band = 0.22% If the dead band is 0.1% the hysteresis is 0.12%
Linearity The closeness to which a curve is approximates a straight line • The linearity of curve a is better then curve b. • It is usually measured as a nonlinearity and is expressed as linearity e.g. a maximum deviation between an average curve and a straight line. • There are 3 type of linearity i.e. independent, terminal based, and zero based linearity output a b input
Independent Linearity output • It is the maximum deviation of calibration curve (averaged of upscale and down scale reading) from a straight line so positioned as to minimized the maximum deviation. input Max ± deviation are minimized And equal
Terminal based Linearity output • It is the maximum deviation of calibration curve (averaged of upscale and down scale reading) from a straight line coinciding with the calibration curve at the upper and lower range values input Max deviation
Zero based Linearity output • It is the maximum deviation of calibration curve (averaged of upscale and down scale reading) from a straight line so positioned as to minimized the maximum deviation and coincide with the lower range value. input Max ± deviation are minimized
Measuring Linearity • Take the average deviation for every input • Find the straight line for independent, terminal based, and zero based linearity. • Compute the linearity
0.4 0.3 0.2 0.1 0.0 -0.1 -0.2 -0.3 -0.4 • Independent linearity =.18% • Terminal based linearity =.28% • Zero based linearity =0.21% terminal based straight line 2 1 3 zero based straight line independent straight line
Repeatability The closeness of agreement among number of consecutive measurement for the output of the same value of the input under the same operating condition approaching from the same direction. It is usually measured in non-repeatability and measured as repeatability in percent of span Down scale calibration curve output Upscale calibration curve Repeatability input
Repeatability Repeatability =0.05%
Motion sensors • These transducers measure the following variables: displacement, velocity, acceleration, force, and stress. • Such measurements are used in mechanical equipment such as servo-systems, robots, and electrical drive systems. • Motion sensors include the following types of devices: potentiometers, resolvers, optical encoders, variable inductance sensors (displacement), tachometers (velocity), piezo-resistive sensors (strain).
Resolver • Resolvers are used in accurate servo and robot systems to measure angular displacement. Their signal can be differentiated to obtain the velocity. • The rotor is connected with the rotating object and contains a primary coil supplied by an alternating current from a source voltage vref. The stator consists of two windings separated by 90o, with induced voltages V01= K vref sin θ V02= K vref sin θ
Tachometer • The permanent magnet generates a steady and uniform magnetic field. Relative • motion between the field and the rotor induces voltages, which is proportional • to the speed of the rotor. • The inductance gives the tachometer a certain time constant so that the • tachometer cannot measure fast transient accurately.
Optical encoders • These are optical devices to measure angular displacement and angular velocity. • A disk of an optical encoder is connected to the rotating shaft. • The disk has patterns (holes). • On one side of the disk there is a light source and on the other photo-detectors. When the disk rotates the light is going through the holes and the photo-detectors generate series of pulses. • There are two types of optical encoders: incremental and absolute.
Optical encoders • The incremental encoder provides a pulse each time the shaft has rotated a defined distance. • The disc of an absolute encoder has several concentric tracks, with each track having an independent light source and photo detector. • With this arrangement a unique binary or Gray coded number can be produced for every shaft position.
LVDT • The two secondary coils are connected in the opposite phase. When the core is in the middle there is no output voltage. • Moving the core from the central position unbalances the secondary coils, developing an output. Vout displacement
Strain gauge • When external forces are applied to a stationary object, stress and strain are the result. • Stress is defined as