Download
1 / 12
130 likes | 322 Views
WL3100 Dry Pressure Transducer. Temperature Compensated Measurement LCD Display SDI-12 interface 4-20mA interface (at the same time) Option : Extra SDI-12. By : Steve Laurence Hydrological Services P/L. Using a Bubbler to Measure Pressure :. Deriving the Relationship :.

E N D
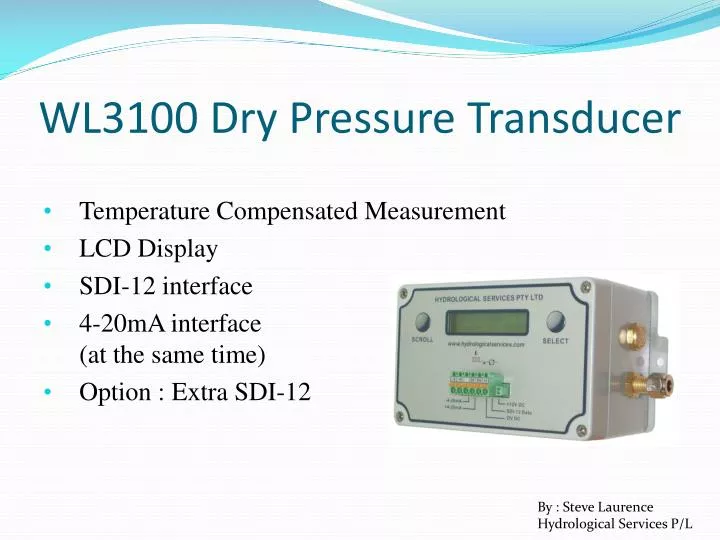
WL3100 Dry Pressure Transducer • Temperature Compensated Measurement • LCD Display • SDI-12 interface • 4-20mA interface(at the same time) • Option : Extra SDI-12 By : Steve Laurence Hydrological Services P/L
Deriving the Relationship : We are taught that : “Force = mass x acceleration” the amount of force that a body of water exerts is dependent upon the acceleration due to gravity. The mass of an object is : “mass = volume x density” so now we have : Force = mass x acceleration due to gravity = (volume x density) x gravity = (area x depth x density) x gravity Relating back to pressure : “Pressure = Force / Area” (substitute the Force from above) = (area x depth x density) x gravity / area (area cancels) Pressure = depth x density x gravity Solve for depth : Depth = Pressure / ( density x gravity) Water Depth = Pressure x (1 / (density x gravity)) Therefore : User Factor = 1 / (density x gravity) NOTE : We have now shown that the User Factor is a function of water density and gravity !!! You might think they are both constants, but you would be wrong !!!!!!!!! The User Factor we use is 0.101972 m / kPa
Water Salinity : • As water salinity increases, the density increases • The User Factor is proportional to 1 / density • Therefore the User Factor will decrease as salinity increases.
LCD Menus : Navigate with the “Scroll” and “Select” buttons
Setting Up 4-20mA : • The 4-20mA circuit is optically isolated from the rest of the electronics • Therefore it must be powered by the loop • Set the 4mA Level using the WL3100 LCD menu • Set the 20mA Level using the WL3100 LCD menu(You can use –ve levels) 4mA / 20mA Level 0.0 / 10.0 m To conserve power, the data logger switches power to the 4-20mA circuit only when it wants to make a measurement. ML420 Data Logger measuring the 4-20mA
Sampling Modes : WL3100 S/W Rev 7.1 (and lower) • When “Continuous Mode” is set to “NO” the WL3100 only takes a sample when : • - The water level is displayed on the LCD or • - An SDI-12 Measure command is received or • - The 4-20mA loop power is detected. • When “Continuous Mode” is set to “YES” the WL3100 takes a sample : • Every 12 secs. (Continuously) • (This is useful if you use the SDI-12 command 0R0! as it will immediately return the most recent measurement made within the last 12 secs – which makes the WL3100 SDI-12 interface the same as the AD375A SDI-12 interface. It can also be useful when using the 4-20mA interface, as the 4-20mA loop current will be accurately updated 100mS after loop power is applied – without having to wait 12 secs for a measurement to be made !!)
Sampling Modes : WL3100 S/W Rev 7.2 (and higher) • When “Sampling Mode” is set to “Single” the WL3100 only takes a sample when : • - The water level is displayed on the LCD or • - An SDI-12 Measure command is received or • - The 4-20mA loop power is detected. • When “Sampling Mode” is set to “Contin+Avg X” the WL3100 takes a sample : • -Every 12 secs. (Continuously)(When a sample is requested, via the display or via SDI-12 or 4-20mA, the last X samples are averaged. If it is known that the water level will change very slowly, it is advantageous to set X to a high number, so that the last say 20 samples will be averaged.)
Sampling Modes : 5 Sample Average Example :
Full Temperature Compensation : • Each WL3100 undergoes a full Temperature Compensation Calibration at our factory in Liverpool. • 10 units at a time in our Environmental Chamber • -20C, -10C, 0C, 10C, 20C, 30C, 40C, 50C, 60C, 70Cfor a 1 hour soak, for everything to stabilise • At each temperature we do a 7 point pressure calibration over the required range : 0%, 15%, 35%, 50%, 65%, 85%, 100% • Ruska 7250i pressure calibrator is accurate to 0.005%(for example 10.000m x 0.005% = 0.5mm) • Calibration of each unit takes over 24 hours
Field Calibration Check HS40 : • Navigate to the WL3100 “View Pressure” display • Set River Line Select to “Close” position • Set Calibrate Valve to “Calibrate” position • Set the Pump Up calibrator to “Vent” • Connect Pump Up calibrator to the Bubble Rate Test PortCalibrator Pressure is now read on the WL3100 • Remove Pump Up calibrator from Bubble Rate Test Port • Set Calibrate Valve to “Open” • Set River Line Select to “Open”