Download
1 / 52
520 likes | 523 Views
Explore global change examples through hands-on experiments on salt content in seawater, water density, and convection. Learn how systems analysis can help make sense of complex systems.

E N D
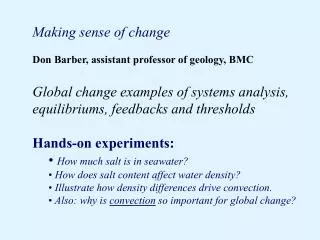
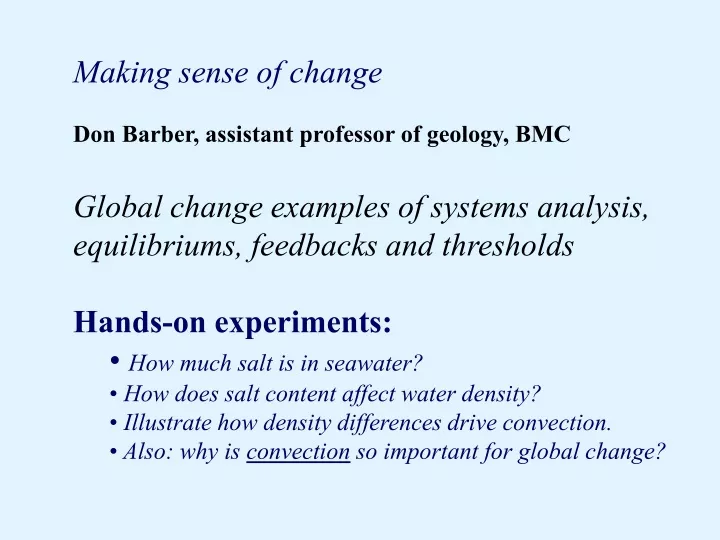
Making sense of change • Don Barber, assistant professor of geology, BMC • Global change examples of systems analysis, equilibriums, feedbacks and thresholds • Hands-on experiments: • How much salt is in seawater? • How does salt content affect water density? • Illustrate how density differences drive convection. • Also: why is convection so important for global change?
A question for reflection: • List a global environmental change issue. • After each one, write the number one question/piece of information you think would help you make sense of this issue.
my philosophy… • I view Spaceship Earth as one Global Ecosystem… • Very beautiful, but very complex… just like the human mind/body system. Hard to understand how it all works! • Systemsanalysis breaks this beautifully complex system into simpler components. • We graphically examine how changes in one part of the system influence other parts of the system.
Concepts and content: • Part 1: • Define system properties and behavior. • Make sense of (and use) x-y graphs. • Learn and apply rules for drawing systems diagrams. • Use graphs and diagrams to make sense of a few systems. • Part 2: • Illustrate how much salt is in ocean water. • Examine consequences of water density differences, example: fluids layered by density; buoyancy effects. • Illustrate density driven convection.
Systems- your classroom as example: • Types of systems: • Open: matter & energy can flow to/from • Closed: no matter transfer, but energy can come and go • Isolated: neither energy nor matter flows into or out of the system “box.”
Systems- your classroom as example: • couplings between system components, how things interact “change in X directly causes a change in Y” Classroom Variable A X Classroom variable B Y coupling
Systems- your classroom as example: • couplings are analyzed as X-Y graphs showing how things interact: “change in X directly causes a change in Y” example below is negative coupling long Student attention span short cool warm Classroom temperature
System feedbacks and feedback loops: Coupling 1 Classroom Temperature X1 Y2 Student attention span Y1 X2 Coupling 2
System feedbacks and feedback loops: • two negative couplings 1 long Student attention span 2 hot short room temp. cool warm Classroom temperature cool short long attention span
System feedbacks and feedback loops: • Analyze by multiplying signs of couplings around loop, • e.g., negative times negative equals positive • two negative couplings create one • positive feedback loop… but it’s not a good thing! Classroom Temperature X1 Y2 Student attention span Y1 X2
Systems- • system equilibrium: (stable / unstable) • perturbations & forcing(s) • thresholds
Systems- your classroom as example: • example of stable equilibrium… negative feedbacks tend to minimize perturbations and restore system to original state
Systems- example of unstable equilibrium… positive feedback reinforces (exacerbates) even small perturbations, pushing system far away from original previous state, possibly into a new stable equilibrium 1 2
How does the temperature/attention span classroom system behave? What happens if a perturbation occurs… a distraction, or a temperature change?
Earth system behavior and feedback Earth albedo example How does Earth’s reflectiveness, or albedo, affect the capture of incoming solar radiation (insolation), which thence influences Earth’s surface temperature? Albedo = fraction of incoming solar energy that is reflected away total reflection: albedo = 1 total absorption: albedo = 0
Albedo: fraction of incoming energy that is reflected total reflection: albedo = 1 total absorption: albedo = 0 Rank from highest to lowest: Forest Snow Water
Land surfaces exhibit various albedos
Albedo: surface reflectivity total reflection = 1 total absorption = 0 Sand ~0.26 Grass ~0.23 Forest ~0.07 Water 0.03 - 0.80 (note large range) Snow ~0.82 Cloud ~0.75
Concepts: System properties and behavior: definitions Rules for drawing and interpreting systems diagrams (albedo example)
Qualitatively evaluate: • 1. Effect of temperature on snow coverage? • 2. Effect of snow amount on albedo? • 3. Effect of albedo on temperature? system component snow coupling1 coupling2 Tsurface system component Planetary albedo coupling3 system component
Exercise: Draw quantitative graphs relating: • Temperature (200-400 K) is coupled to snow coverage (0 - 100%) • 2. Snow cover (0 - 100%) --> albedo (0 - 1) • 3. Albedo (0 - 1) --> temperature (200-400 K) • Don’t confuse COMPONENTS with COUPLINGS ! snow graph1 graph2 Tsurface albedo graph3
Exercise: Draw three quantitative graphs relating: • 1. Temperature (200-400 K) to snow coverage (0 - 100%) • 2. Snow cover (0 - 100%) to albedo (0 - 1) • 3. Albedo (0 - 1) to temperature (200-400 K) ?1 ?2 albedo snow Tsurface snow ?3 Tsurface albedo
Slope of lines on these graphs set the SIGN (+ or -) of couplings. albedo snow Tsurface snow Tsurface albedo
Symbol use for systems diagrams negative coupling positive coupling ALSO NOTE DIRECTION OF COUPLING… the x (independent) variable dictates to the y (dependent) variable. So the coupling direction on your systems box diagram goes from x to y.
negative positive albedo snow Tsurface snow negative Tsurface albedo
snow coverage (—) (+) Tsurface (—) albedo Systems diagram symbols negative coupling positive coupling NOTE COUPLING DIRECTION !
snow coverage (—) (+) Tsurface (—) albedo Is this a positive or negative feedback loop? multiply it out, see if positive or negative, e.g.: (—) x (+) x (—) = + This is a positive feedback loop.
snow Tsurface albedo PERTURBATIONS AND FORCINGS What is the effect of external warming (forcing)? (e.g., 2°C) Feedback factor ratio: > 1 or < 1 ?
Think about classroom as system Describe system (interactions among components). [Keep it simple. Remember there must be feedback to make a feedback loop.] Draw graphs and diagrams and analyze. Positive or negative feedback loop?
Concepts and content: • Part 1: • Make sense of (and use) x-y graphs. • Define system properties and behavior. • Learn and apply rules for drawing systems diagrams. • Use graphs and diagrams to make sense of a few systems. • Part 2: • Illustrate how much salt is in ocean water. • Examine consequences of water density differences, example: fluids layered by density; buoyancy. • Illustrate density driven convection.
Global change- water density, salt and convection • Ocean circulation, weather and climate • Ocean consists of a thin, well stirred layer of surface water and a much thicker mass of deep water that is cold, “calm” and relatively slow moving. • What stirs the surface water? • What makes the deep ocean water move around? • Saltiness of the ocean is about 35 gmsalt/kgsea water, or 35 parts per thousand. • How much salt is that?
Water density and convection Fresh water… warm water is less dense; maximum density at 4°C; ice is much less dense (tricky!). Salt water (simpler)… warm water less dense, cold water is more dense; higher salt concentration means more dense.
Air convection patterns Global wind patterns result from heating and convection