Download
1 / 1
10 likes | 113 Views
Service. Discharges. %. MLOS. Wt. Discharges. %. MLOS. Wt. Discharges. MLOS. Wt. 85. GYNAECOLOGY. 1514. 16.9%. 3.18. 0.821. 1292. 14.9%. 3.20. 0.814. 17.2%. -0.5%. 0.9%. 20. GENERAL SURGERY. 1502. 16.8%. 5.89. 1.341. 1406. 16.2%. 5.62. 1.351. 6.8%.

E N D
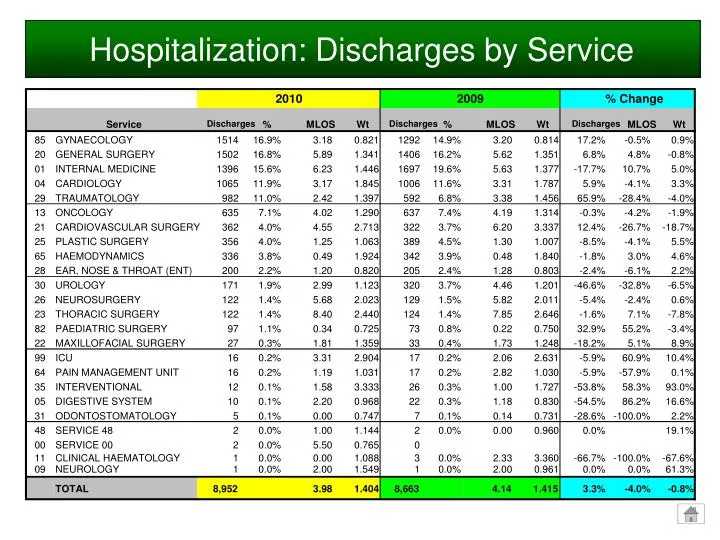
Service Discharges % MLOS Wt Discharges % MLOS Wt Discharges MLOS Wt 85 GYNAECOLOGY 1514 16.9% 3.18 0.821 1292 14.9% 3.20 0.814 17.2% -0.5% 0.9% 20 GENERAL SURGERY 1502 16.8% 5.89 1.341 1406 16.2% 5.62 1.351 6.8% 4.8% -0.8% 01 INTERNAL MEDICINE 1396 15.6% 6.23 1.446 1697 19.6% 5.63 1.377 -17.7% 10.7% 5.0% 04 CARDIOLOGY 1065 11.9% 3.17 1.845 1006 11.6% 3.31 1.787 5.9% -4.1% 3.3% 29 TRAUMATOLOGY 982 11.0% 2.42 1.397 592 6.8% 3.38 1.456 65.9% -28.4% -4.0% 13 ONCOLOGY 635 7.1% 4.02 1.290 637 7.4% 4.19 1.314 -0.3% -4.2% -1.9% 21 CARDIOVASCULAR SURGERY 362 4.0% 4.55 2.713 322 3.7% 6.20 3.337 12.4% -26.7% -18.7% 25 PLASTIC SURGERY 356 4.0% 1.25 1.063 389 4.5% 1.30 1.007 -8.5% -4.1% 5.5% 65 HAEMODYNAMICS 336 3.8% 0.49 1.924 342 3.9% 0.48 1.840 -1.8% 3.0% 4.6% 28 EAR, NOSE & THROAT (ENT) 200 2.2% 1.20 0.820 205 2.4% 1.28 0.803 -2.4% -6.1% 2.2% 30 UROLOGY 171 1.9% 2.99 1.123 320 3.7% 4.46 1.201 -46.6% -32.8% -6.5% 26 NEUROSURGERY 122 1.4% 5.68 2.023 129 1.5% 5.82 2.011 -5.4% -2.4% 0.6% 23 THORACIC SURGERY 122 1.4% 8.40 2.440 124 1.4% 7.85 2.646 -1.6% 7.1% -7.8% 82 PAEDIATRIC SURGERY 97 1.1% 0.34 0.725 73 Hospitalization: Discharges by Service 2010 2009 % Change 0.8% 0.22 0.750 32.9% 55.2% -3.4% 22 MAXILLOFACIAL SURGERY 27 0.3% 1.81 1.359 33 0.4% 1.73 1.248 -18.2% 5.1% 8.9% 99 ICU 16 0.2% 3.31 2.904 17 0.2% 2.06 2.631 -5.9% 60.9% 10.4% 64 PAIN MANAGEMENT UNIT 16 0.2% 1.19 1.031 17 0.2% 2.82 1.030 -5.9% -57.9% 0.1% 35 INTERVENTIONAL 12 0.1% 1.58 3.333 26 0.3% 1.00 1.727 -53.8% 58.3% 93.0% 05 DIGESTIVE SYSTEM 10 0.1% 2.20 0.968 22 0.3% 1.18 0.830 -54.5% 86.2% 16.6% 31 ODONTOSTOMATOLOGY 5 0.1% 0.00 0.747 7 0.1% 0.14 0.731 -28.6% -100.0% 2.2% 48 SERVICE 48 2 0.0% 1.00 1.144 2 0.0% 0.00 0.960 0.0% 19.1% 00 SERVICE 00 2 0.0% 5.50 0.765 0 11 CLINICAL HAEMATOLOGY 1 0.0% 0.00 1.088 3 0.0% 2.33 3.360 -66.7% -100.0% -67.6% 09 NEUROLOGY 1 0.0% 2.00 1.549 1 0.0% 2.00 0.961 0.0% 0.0% 61.3% TOTAL 8,952 3.98 1.404 8,663 4.14 1.415 3.3% -4.0% -0.8%