Download
1 / 1
10 likes | 113 Views
11 Inches of Snow from an Alberta Clipper?! Post-Analysis of an Unlikely Heavy Snow Event Scott M. Rochette 1 and Thomas A. Niziol 2 1 Department of the Earth Sciences, SUNY College at Brockport 2 NOAA/NWSFO Buffalo, NY. 1800 UTC 11 January 2004 (f06). 0000 UTC 12 January 2004 (f12).

E N D
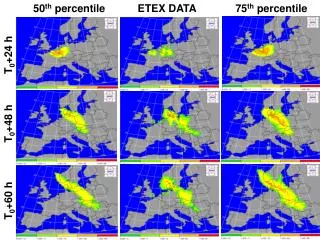
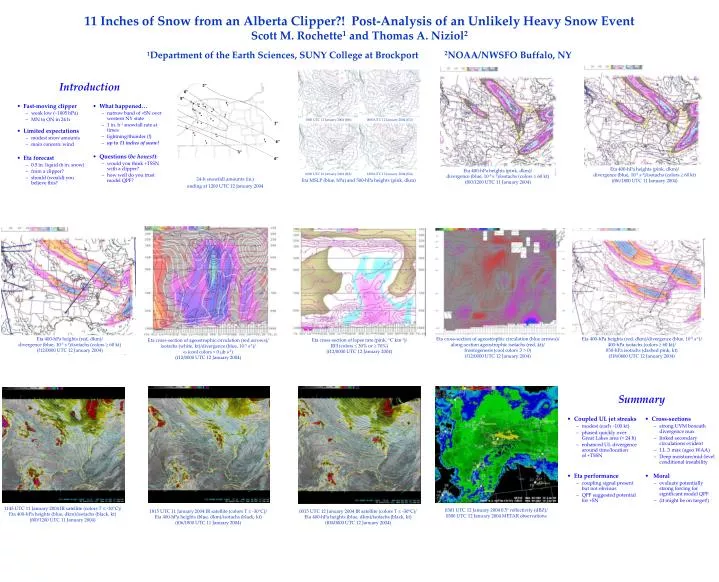
11 Inches of Snow from an Alberta Clipper?! Post-Analysis of an Unlikely Heavy Snow EventScott M. Rochette1 and Thomas A. Niziol21Department of the Earth Sciences, SUNY College at Brockport 2NOAA/NWSFO Buffalo, NY 1800 UTC 11 January 2004 (f06) 0000 UTC 12 January 2004 (f12) Eta 400-hPa heights (pink, dkm)/ divergence (blue, 10-5 s-1)/isotachs (colors 60 kt) (f06/1800 UTC 11 January 2004) Eta 400-hPa heights (pink, dkm)/ divergence (blue, 10-5 s-1)/isotachs (colors 60 kt) (f00/1200 UTC 11 January 2004) 0600 UTC 12 January 2004 (f18) 1200 UTC 12 January 2004 (f24) 24-h snowfall amounts (in.) ending at 1200 UTC 12 January 2004 Eta MSLP (blue, hPa) and 500-hPa heights (pink, dkm) Eta 400-hPa heights (red, dkm)/ divergence (blue, 10-5 s-1)/isotachs (colors 60 kt) (f12/0000 UTC 12 January 2004) Eta cross-section of ageostrophic circulation (blue arrows)/ along-section ageostrophic isotachs (red, kt)/ frontogenesis (cool colors > 0) (f12/0000 UTC 12 January 2004) Eta 400-hPa heights (red, dkm)/divergence (blue, 10-5 s-1)/ 400-hPa isotachs (colors 60 kt)/ 850-hPa isotachs (dashed pink, kt) (f18/0600 UTC 12 January 2004) Eta cross-section of lapse rate (pink, C km-1)/ RH (colors 30% or 70%) (f12/0000 UTC 12 January 2004) Eta cross-section of ageostrophic circulation (red arrows)/ isotachs (white, kt)/divergence (blue, 10-5 s-1)/ (cool colors < 0 b s-1) (f12/0000 UTC 12 January 2004) 1145 UTC 11 January 2004 IR satellite (colors T -30C)/ Eta 400-hPa heights (blue, dkm)/isotachs (black, kt) (f00/1200 UTC 11 January 2004) 0301 UTC 12 January 2004 0.5 reflectivity (dBZ)/ 0300 UTC 12 January 2004 METAR observations 1815 UTC 11 January 2004 IR satellite (colors T -30C)/ Eta 400-hPa heights (blue, dkm)/isotachs (black, kt) (f06/1800 UTC 11 January 2004) 0015 UTC 12 January 2004 IR satellite (colors T -30C)/ Eta 400-hPa heights (blue, dkm)/isotachs (black, kt) (f00/0000 UTC 12 January 2004)