Download
1 / 12
120 likes | 162 Views
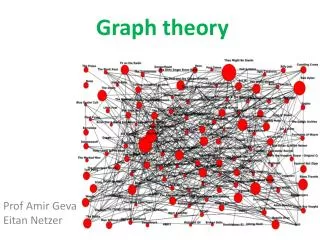
Applying Abstract Algebra and Graph Theory to Model Flu Seasons. By Ben Hughes, schleyfox@gmail.com Collaboration: Prateek Vasireddy and Casey Glass (High School students) Olgamary Rivera-Marrero and Brandy Stigler (VT math graduate students).

E N D
Applying Abstract Algebra and Graph Theory toModel Flu Seasons By Ben Hughes, schleyfox@gmail.comCollaboration: Prateek Vasireddy and Casey Glass (High School students)Olgamary Rivera-Marrero and Brandy Stigler (VT math graduate students) April 30, 2005DIMACS Conference on Linking Mathematics and Biology in High Schools
What is the flu? • A respiratory illness • The Influenza virus can range from mild to life threatening • 10%-20% of U.S. Residents get the flu • 36,000 Americans die from complications of flu each year.
Graph: Flu Mortality rates Complications Complications from the flu include pneumonia, dehydration, and worsening of preexisting medical conditions. The flu can be, and often is, fatal.
Mission • Predict which region in Virginia has a higher possibility of an epidemic for the near-future Abstract Algebra Graph Theory • Determine the most central location to build a clinic • Determine the minimal number of infectious disease specialists to have on staff at the clinic • Decide what types of prevention methods the specialist should use • Find an optimal route for the R.N to travel & administer vaccinations
Virginia Department of Health Flu Activity Statistics NW N SW C E 1996 124 2 579 9 243 1997 116 22 310 1 68 1998 181 34 758 33 154 1999 407 132 1603 102 314 2000 337 110 1120 50 292 2001 362 141 903 161 396 2002 795 345 887 534 925 2003 3017 1791 4789 3599 5451 Predicting Epidemics • Using data from Virginia Department of Health, a model was created Northwest (NW) – 1 Northern (N) – 2 Southwest (SW)– 3 Central (C) – 4 Eastern (E) – 5 (http://www.vdh.state.va.us/).
How we made the model NW N SW C E 2001 0 0 1 0 0 2002 1 0 1 0 1 2003 0 0 1 0 1 Dependency graph We took the flu activity data and normalized it by computing the highest value and dividing everything by it and then multiplying by 100. 2. Then we created a basic model in DVD(Discrete Visualizer of Dynamics) using the functions. 3. Then we added zero-polynomials to the functions to account for borders and other factors we believed might affect the spread of the flu until we got the dependency graph on the right. Then we rendered the state space graph that is seen on the next slide.
What the model showed 2001 2002 2003 2004 2005 NW N SW C E • Central and Northwest Virginia will have epidemics on 2005 • Southwest Virginia borders both of those regions • We chose Pittsylvania County for a clinic because of its size (and we live there)
Clinic and the Specialists Using a shortest path and vertex coloring we determined both the mostcentral city (Chatham) and the minimum number of specialists needed (3). Mathematical Modeling: Using Graphs and Matrices
Clinic and the Specialists • One specialist will give speeches to the community • Another will teach first aid classes to help make people aware of what to do about the flu • The other one will pass out posters like the one below.
RN's AKA Flu-Shooters Because vaccination is an effective way of preventing the flu, RNs, or “flu-shooters,” must be sent to each town/city in the county. By finding a Hamilton circuit(a graph where one can pass through each vertex exactly once and return to the starting location) we found one of the most efficient path for an RN to take. http://www.utc.edu/Faculty/ChristopheMawata/petersen/lesson12b.htm
Conclusions • We were able to make mathematical models for our prediction and prevention of the flu in Southwest Virginia
References • ww.cdc.gov/flu/keyfacts • Mathematical Modeling: Using Graphs & Matrices Learning in motion software - http://www.learn.motion.com/products/modeling/index.html • DVD - Discrete Visualizer of Dynamicshttp://dvd.vbi.vt.edu/visualizer/new_dvd11.pl • Graph Theory Lessons – Euler Circuit and Hamiltonian Circuithttp://www.utc.edu/Faculty/ChristopheMawata/petersen/lesson12b.htm