Download
1 / 35
350 likes | 468 Views
Changing Climate . . . Linkages to LA Agriculture. Jay Grymes WAFB Chief Meteorologist LSU AgCenter Climatologist. LSU AgOutlook 2010 21 January 2010. “Global Warming” generally refers to the apparent warming of

E N D
Changing Climate . . . Linkages to LA Agriculture Jay Grymes WAFB Chief Meteorologist LSU AgCenter Climatologist LSU AgOutlook 2010 21 January 2010
“Global Warming” generally refers to the apparent warming of the Earth over the past 100+ years . . . and implies a human impact or influence “Climate Change” refers to periodic shifts -- and temporal and spatial variability -- of Earth’s local, regional, and global climate may include a human factor, but acknowledges that these variations have always occurred “climate change” is more than the changes in temperature
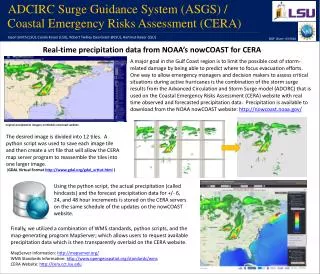
NOAA 3-MonthClimate Outlooks Don’t over-interpret these “outlooks”! Think of these as ‘Confidence Maps’ and not indicators of the amount of departure Source: NOAA / NWS Climate Prediction Center www.cpc.ncep.noaa.gov
What about Louisiana’s Climate? -- has demonstrated change over the last 100+ years -- changes and variability are not identical across the state -- changes are not necessarily 1-directional
Comparison of Monthly Average Rainfall: NW LA vs. SE LA “To understand the impacts and importance of variability and change, we recognize the state’s long-term climatic patterns”
‘Wet’ October -- generally ‘wet’ statewide Source: NWS Doppler radar composite http://weather.water.gov
‘Dry’ November -- ‘dry’ to ‘very-dry’ statewide Source: NWS Doppler radar composite http://weather.water.gov
‘Mixed’ December -- ‘dry’ North to ‘record-wet’ south Source: NWS Doppler radar composite http://weather.water.gov
‘Dry’ January (so far) -- generally ‘dry’ statewide Source: NWS Doppler radar composite http://weather.water.gov
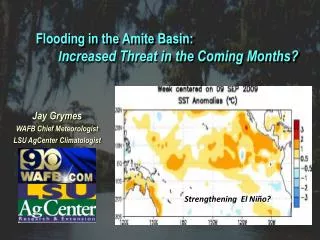
El Niño is Back Source: NOAA Climate Prediction Center www.cpc.ncep.noaa.gov
El Niño ‘Signature’ along the Gulf Coast: ‘Active’ Sub-Tropical Jet Sub-Tropical Jet More Frequent Gulf Lows ”Warm” SSTs
Forecast Model Predictions for the current El Niño: as of mid-December El Niño Current El Niño . . . expected to persist at ‘moderate to strong’ intensity into Spring 2010 La Nada La Niña Source: http://iri.columbia.edu/climate/ENSO/currentinfo/SST_table.html#figure
ENSO – El Niño / Southern Oscillation Three Phases: El Niño (“warm” ocean phase) La Niña (“cool” ocean phase) La Nada (“neutral” ocean temps) El Niño La Nada La Niña
U.S. Rainfall Trends since mid-1960s (Dark Green = 2”+ per decade) Source: NOAA National Climatic Data Center www.ncdc.noaa.edu
Regional / local scale variability in moisture characteristics Source: Nat’l Climate Data Center www.ncdc.noaa.gov
“Medieval Warm Period” “Little Ice Age” Source: Surface Temperature Reconstructions for the Last 2,000 Years (2006). National Research Council, National Academy of Sciences. National Academies Press, Washington, DC.
A Warmer, CO2 ‘Enriched’ Atmosphere . . . What’s missing? Fischer et al, 2002
CO2 CO2 concentrations are believed to be the highest in least 650,000 years. CH4(methane) and N2O are bi-products of human activity, mainly as a result of agriculture. CH4 N2O IPCC (2007). Climate Change 2007: The Physical Science Basis – Summary for Policymakers
Annual Precipitation Projections to 2100 : Two ‘Modeled’ Examples
Current and Future Southern Ecosystems (MAPSS Biogeography Model) Temperate Deciduous Forest Southeast Mixed Forest TropicalBroadleaf Forest Savanna/Woodland Current Grassland Shrub Woodland Canadian Model 2100 Hadley2 Model 2100 CCC 2100
Does this imply a semi-permanent “El Nino-like” climate for the future?
Louisiana’s Climate Outlook . . . for the Next 10 to 100 years Probable: - modest warming - greater year-to-year variability -- moreextreme events? Possible: - significant warming - substantial drop in rainfall in LA
American Assoc. of State Climatologists (2001) “. . . climate predictions have not demonstrated skill in projecting future variability and changes in . . . growing seasons, drought, flood-producing rainfall, heat waves, tropical cyclones and winter storms.”
“ [However] . . . effective mitigation/adaptation policies and strategies need not depend on the precision and confidence in future predictions …” . . . and . . . “… a lack of predictive skill in GCMs should not be used as a justification to avoid policy development and implementation that fosters ‘environmental stewardship’ and ecological responsibility.” AASC (2001)
One guy’s perspective?!? At a 2006 EPA workshop, I proposed: “Even if the threat of global warming/climate change is being overstated, the most ‘modest’ of impacts could have dire effects on Louisiana . . . Louisiana may be the most adversely impacted of any state in the nation.”
“Thank You!” Jay Grymes WAFB Chief Meteorologist LSU AgCenter Climatologist jgrymes @ wafb.com jgrymes @ lsu.edu 225 / 215-4713