Download
1 / 13
130 likes | 265 Views
Extreme Temperature events in wi cities. AOS 101 Weather and Climate Lisha M. Roubert University of Wisconsin-Madison Department of Atmospheric & Oceanic Sciences. Recap of Last Week’s Class-Wisconsin Climate. In Wisconsin we experience all 4 seasons.

E N D
Extreme Temperature events in wi cities AOS 101 Weather and Climate Lisha M. Roubert University of Wisconsin-Madison Department of Atmospheric & Oceanic Sciences
Recap of Last Week’s Class-Wisconsin Climate • In Wisconsin we experience all 4 seasons. • summer temperatures- between 70- 80 degrees • winter temperatures-well below freezing • Wisconsin is becoming “less cold”. • Average increase of 1.1˚F • Northwest Wisconsin is warming more • Projections indicate that Wisconsin will warm from 4-9˚F.
Today • You will be studying extreme temperatures of selected WI cities. • You will be studying periods of unusually high and unusually cold temperatures in different WI cities.
Heat Waves • Heat waves constitutes several consecutive days of extremely high temperatures. • They are accompanied by very high humidity levels. • We can say that there is a heat wave when daily maximum temperature of more than five consecutive days exceeds the average maximum temperature by 5 Celsius degrees (9 Fahrenheit degrees).
How do Heat Waves occur? • In the summer in warm climates, in an area of high pressure with little or no rain or clouds, the air and ground easily heats to excess. A static high pressure area can impose a very persistent heat wave. • The position of the jet stream allows air on one side to be considerably warmer than the other side. Jet stream-a current of fast moving air in the upper levels of the troposphere. Its position and strength relate to the surface temperature contrast between warm and cold areas on Earth.
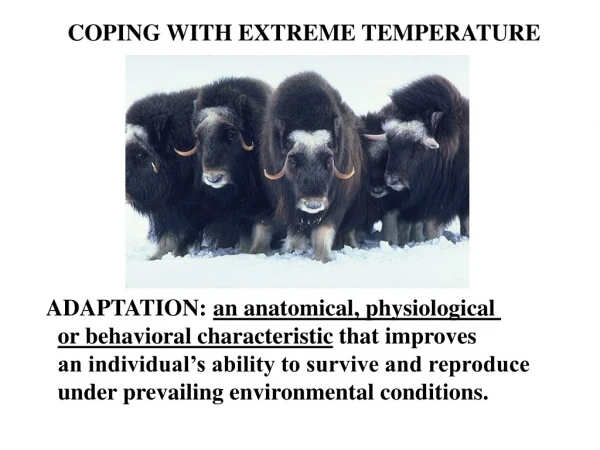
Cold Waves • A cold wave is distinguished by a rapid cooling of air in a 24 hour period. It is marked by an entry of a very cold mass of air into a large area. • A Cold Wave may also be a period of extremely cold and bad weather. This weather can produce winds that lead to strong wind chills. Cold waves can also occur before or after phenomena such as ice storms and blizzards. • The precise criterion for a cold wave is determined by the rate at which the temperature falls, and the minimum to which it falls.
How do cold waves occur? • The jet stream develops a large wave pattern with a surface low and surface high. • Warm air transported northward in the region of the Pacific contributes to intensify the ridge. • Cold air transported southward from Canada east of the High amplifies the trough.
Techniques you will need for today’s lab: • Last time you learned how to calculate in Excel: • Means • Medians • Standard Deviations • Today you will be making box plots and calculating temperature anomalies.
Purpose: Anomalies tell us how much values depart from the average. Anomalies • Why are anomalies used? Anomalies are used to determine if there are noticeable changes in temperature, precipitation, etc. For example: we use SST anomalies to detect changes in SST associated to El Nino or La Nina.
How are anomalies illustrated in a plot? Temperature Anomaly =Temperature-Average Temperature
Purpose: Good tool for conveying location and variation information in data sets. Box Plots In a box plot we: • Calculate the median and the quartiles (the lower quartile is the 25th percentile and the upper quartile is the 75th percentile). • Plot a symbol at the median (or draw a line) and draw a box (hence the name--box plot) between the lower and upper quartiles; this box represents the middle 50% of the data. • Draw a line from the lower quartile to the minimum point and another line from the upper quartile to the maximum point. Typically a symbol is drawn at these minimum and maximum points, although this is optional. Thus the box plot identifies the middle 50% of the data, the median, and the extreme points. Vertical axis: Response variableHorizontal axis: The factor of interest
Homework: • Study for quiz #1 Next Week. • The material in the quiz will be from the first two labs: Lab#1 and Lab#2