Download

1 / 8
150 likes | 1.39k Views
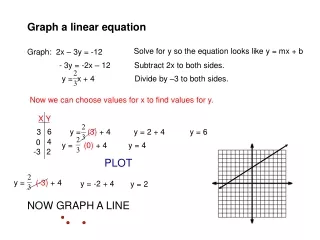
Graph a linear equation. Solve for y so the equation looks like y = mx + b. Graph: 2x – 3y = -12 . - 3y = -2x – 12 Subtract 2x to both sides. y = x + 4 Divide by –3 to both sides. Now we can choose values for x to find values for y. . X Y. 6. 3. y = (3) + 4. y = 2 + 4.

E N D
Graph a linear equation Solve for y so the equation looks like y = mx + b Graph: 2x – 3y = -12 - 3y = -2x – 12 Subtract 2x to both sides. y = x + 4 Divide by –3 to both sides. Now we can choose values for x to find values for y. X Y 6 3 y = (3) + 4 y = 2 + 4 y = 6 4 0 y = (0) + 4 y = 4 -3 2 PLOT y = (-3) + 4 y = -2 + 4 y = 2 NOW GRAPH A LINE
Graph a linear equation Solve for y so the equation looks like y = mx + b Graph: 3x – 4y = 8 - 4y = -3x + 8 Subtract 3x to both sides. y = x – 2 Divide by –4 to both sides. Now we can choose values for x to find values for y. X Y 1 4 y = (4) -2 y = 3 - 2 y = 1 -2 0 y = (0) - 2 y = -2 -4 -5 PLOT y = (-4) - 2 y = -3 - 2 y = -5 NOW GRAPH A LINE
Graph a linear equation Missing a y term, so solve for x Graph: 3x = 6 X = 2 Divide by 3 Now we can graph a line in which the value for x is 2 in all coordinates. Notice the line is vertical because every coordinate on the line has an x coordinate of 2. (2, 6) (2, 0) (2, -5)
Graph a linear equation Missing a x term, so solve for y Graph: -4y = 12 Y = -3 Divide by -4 Now we can graph a line in which the value for y is -4 in all coordinates. Notice the line is horizontal because every coordinate on the line has a y coordinate of -4. (-3, -4) (0, -4) (3, -4)
Graph a linear equation using x and y intercepts. Let x = 0 Graph: 2x – 3y = -12 Now let y = 0 2(0) – 3y = -12 2x – 3(0) = -12 2x – 0 = -12 0 - 3y = -12 2x = -12 -3y = -12 x = -6 y = 4 x intercept is (-6, 0) y intercept is (0, 4) PLOT NOW GRAPH A LINE
Graph a linear equation using x and y intercepts. Let x = 0 Graph: -5x + 3y = -15 Now let y = 0 -5(0) + 3y = -15 -5x + 3(0) = -15 -5x + 0 = -15 0 + 3y = -15 -5x = -15 3y = -15 x = 3 y = -5 x intercept is (3, 0) y intercept is (0, -5) PLOT NOW GRAPH A LINE
Graph a linear equation, by using y intercept and slope. Solve for y so the equation looks like y = mx + b Graph: 2x – 3y = -12 - 3y = -2x – 12 Subtract 2x to both sides. y = x + 4 Divide by –3 to both sides. Now the equation is in y = mx + b form called slope y-intercept form. m is the slope of the line and b is the y-intercept (0, 4) Now plot the y-intercept (0, 4) The slope of the line is so from the coordinate (0, 4) go up 2 lines, then move right 3 lines and plot a 2nd point. UP 2 RIGHT 3 NOW GRAPH A LINE
Graph a line given one point and the slope of the line. Graph the line that passes through the point (-4, 5) and has a slope of . Plot the point (-4, 5) Now from the point (-4, 5) the slope is , so go down 3 lines and then right 5 lines. DOWN 3 RIGHT 5 Now graph the line