Download
1 / 47
470 likes | 590 Views
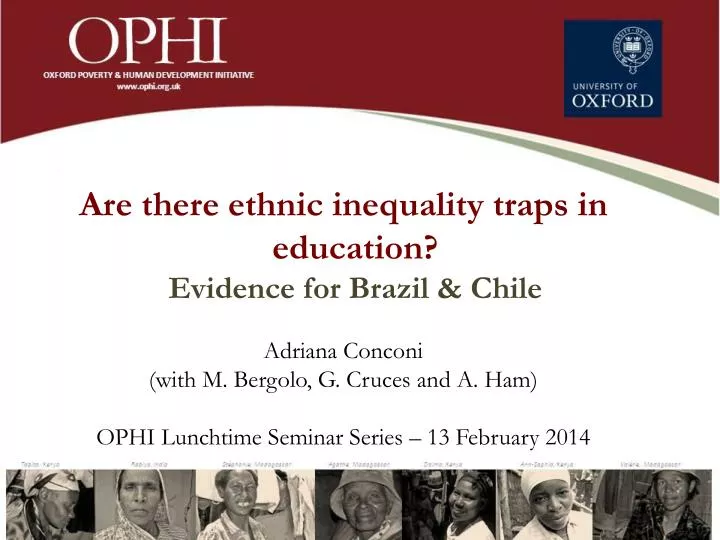
Are there ethnic inequality traps in education? Evidence for Brazil & Chile Adriana Conconi (with M. Bergolo , G. Cruces and A. Ham) OPHI Lunchtime Seminar Series – 13 February 2014. MOTIVATION.

E N D
Are there ethnic inequality traps in education? Evidence for Brazil & Chile Adriana Conconi (with M. Bergolo, G. Cruces and A. Ham) OPHI Lunchtime Seminar Series – 13 February 2014
Gini coefficient, Household per capita income distributionLastavailableobservation in period2000- 2010
Motivation • Disparities among other dimensions are also relevant and persistent in LA (Gasparini et al., 2011). • Education, access to land, health, etc. • Inequalities in these dimensions are also significant between social groups. • Ethnicity, gender, region of birth (urban/rural), etc. • Especially, persistent differences among: • Ethnic groups (Bussoet al. 2005; Gandelmanet al., 2007). • …and particularly, in educational outcomes (Chong and Ñopo, 2007; Guerreiro, 2008). Possible explanation? Inequality traps
What is an inequality trap? Circular process in which unequal opportunities lead to differences in outcomes between social groups (in a Roemerian sense), which contributes to the persistenceof unequal conditions through an intergenerational mobility process. Rao, 2006; Bourguignon and Dessus, 2009; Bourguignon, Ferreira & Walton, JEI2007 (henceforth BFW07).
Example of inequality trap • In patriarchal societies, women are often denied property and inheritance rights, and their freedom of movement is restricted by strictly enforced social norms that serve to create separate “inside” and “outside” spheres of activity for women and men. • Girls are then less likely to be sent to school, and women less likely to work outside the home. This reduces the options for women outside marriage and increases their economic dependence on men. It also makes them less likely to participate in important decisions both within and outside the home. • In other words men are “rich” while women are “poor”. • This nexus of unequal social and economic structures tends to be easily reproduced: If a woman has not been educated and has grown up to believe that “good” women abide by existing social norms, she is likely to transmit this to her daughters. • An inequality trap is created which prevents generations of women from getting educated, restricts their participation in the labor market, and reduces their ability to make free, informed. This reinforces gender differences in power that tend to persist over time.
Research objectives • Test conditions compatible with Educational Inequality Traps (EIT) for ethnic groups. • Brazil: Afro-Brazilians and White-Brazilians (Costa, 2007; Guerreiro, 2008). • Chile : Indigenous and Non-Indigenous (Valenzuela, 2003; López and Miller, 2008; Agostiniet al., 2010). • Are the disadvantaged ethnic groups in these countries trapped in persistently low educational levels compared to the advantaged groups? • Policy relevance: Evidence-based design of public programs – targeted/universal, access/returns, compensatory measures (affirmative action)…
Why Educational Inequality Traps? • Latin America shows: • The highest persistence in intergenerational educational trends (Hertz et al., 2007) and substantial gaps in educational outcomes between certain groups (Gaspariniet al., 2011; Harttgenet al., 2010). • Insufficient educational attainment has long-term consequences. • Education is a key area for policy interventions. • And also: data driven. No long term intergenerational information on incomes, and education is a stock variable measured with (usually) lower degree of error than income.
Why by Ethnicity? • Ethnicityhas been and remains to be a significant source of disparity in Latin American countries (Justino and Acharya, 2003; Busso et al., 2005; Chong and Ñopo, 2007). • Minority ethnic groups in these countries are characterized by worse overall conditions in access to land, housing, health, poverty, political representation and, in particular, schooling (Gandelman et al., 2007). • Bussoet al. (2005) find evidence of increasing ethnic discrimination across the educational distribution throughout Latin America and, particularly, in the countries considered in this paper.
Despite its conceptual appeal, there is no comprehensive methodological framework to empirically test the presence of IT. BFW07 suggest an indirect evidence-based approach which tests necessary conditions that could characterize this long-term process: Persistent inequality of opportunities. Lack of convergence in mobility patterns between social groups and across generations. Feasible alternative equilibrium with no IT. Assessing EIT
Assessing EIT • Our proposed analytic strategy follows BFW07 and has a series of steps for the case of education: • Assess inequality of educational opportunities. • Analyze intergenerational educational mobility • Indicates access to opportunity – ability of each “generation” of the disadvantaged group to overcome its historical disadvantage. …and their patterns of convergence over time. • An increase in mobility does not mean changes in the relative position of the disadvantaged group over time. • The analysis is conducted: • Across consecutive generations/birth-cohorts. • By ethnic groups (circumstance).
Assessing EIT • Expected results from the analytical strategy: • If the evidence indicates that across cohorts and ethnic groups there is: • Persistent differences in educational opportunities. • Non-convergence in intergenerational educational mobility patterns. • …then the evidence suggests that the disadvantaged ethnic group is caught in an EIT.
Previous literature • There are no available studies which directly test for inequality traps at the individual level. • IO: • Educational inequality of opportunity in the access to primary has decreased over time in LAC (Barros et al., 2009), and in particular in Brazil (Cogneau and Gignoux, 2005; Bourguignon et al., 2007b) and in Chile (Larrañaga and Telias, 2009; Contreras et al., 2009) • Evidence for higher educational levels is less abundant. Torche 2010: inequality of opportunity increases at the secondary and university levels in Brazil and Chile.
Previous literature • Intergenerational mobility: • Scarce in developing countries due to the lack of longitudinal data and limited availability of family background information in cross-sectional surveys. • Existing literature (Dahan and Gaviria, 1999; Behrman et al., 2000; Andersen, 2001; Behrman et al., 2001; Binder and Woodruff, 2002; Conconi et al., 2008) finds that parental education is a powerful determinant of schooling outcomes for children in LAC. • Brazil and Chile sticks out at the top of this ranking (Hertz et al., 2007) • Evidence of increasing educational mobility during the last decades. • Less evidence is available comparing mobility between social groups, and most on gender issues (Guerreiro, 2008 for BRA; Hermida, 2008 for GTM)
Methodology • Use two specifications from the family of heterogeneity indices proposed by Yalonetzky (2009, JEI 2010) to: • Assess inequality of opportunities. • Compare discrete-time transition matrices (mobility patterns). • Advantages over other measures (HOI, etc.): • More suitable for ordinal discrete variables (e.g. educational levels). • Same family of indices for mobility and opportunity. • Other desirable properties (see Yalonetzky).
Heterogeneity Index to Measure Inequality of Opportunities • Each group or type is defined by a vector of circumstances: all individuals with the same set of circumstances belong to the same group • E.g. every Afro-Brazilian belongs to the same type in a case where ethnicity is the only circumstance. • An example of a possible element of α would be low, medium or high level of education. G= No groups O= No outcomes
Heterogeneity Index to Measure Inequality of Opportunities • Measures the degree of between-group inequality as the degree of association between groups (e.g. ethnicity) and outcomes (e.g. educational attainments): • Compares conditional probability vectors ( ), i.e. distributions of outcomes conditional on belonging to a specific group. • Captures a notion of horizontal inequality of opportunities, which is exactly what we want to address in an EIT analysis. • Ranges between 0 and 1: • =0 if conditional distribution of educational attainments between ethnic groups is identical (situation of literal equality of opportunity in Roemer’s terms).
Heterogeneity Index for Transition Matrices (Intergenerational Mobility) • A slightly different specification can be used to compare intergenerational mobility patterns, represented by transition matrices. • Transition matrices present the probability of an individual attaining a particular level of socioeconomic status conditional on their parents having achieved a particular level in that variable.
Heterogeneity Index for Transition Matrices (Intergenerational Mobility) • A conditional probability vector is one of the matrix’s columns which contains the probabilities of an individual reaching each possible level of the outcome controlling for the particular level reached by the parents, j.
Heterogeneity Index for Transition Matrices (Intergenerational Mobility) • The index computes the differences between the conditional probability vectors (Vj) of transition matrices across groups individually, and then aggregates into a global indicator which has an asymptotic chi-square distribution with (G-1)O(O-1) degrees of freedom. where
Heterogeneity Index for Transition Matrices (Intergenerational Mobility) • Summary index which quantifies the differences (dissimilarity) between transition matrices of groups (e.g. ethnicities) by comparing them element-by-element: • Computes the differences between the conditional probability vectors of transition matrices across groups ( ). • The observed differences are aggregated across • Ranges between 0 and 1: =0 if conditional distributions of the compared transition matrices are identical (perfect homogeneity between groups/matrices).
Heterogeneity Index for Transition Matrices (Intergenerational Mobility) • A statistic Q which has an asymptotic chi-square distribution with (G-1)O(O-1) degrees of freedom can be used to perform a homogeneity test (Anderson and Goodman, 1957). • If the null hypothesis of homogeneity among matrices was rejected, then • The degree of association among conditional probability vectors statistically differs between groups/matrices.
So we use… • to measure the evolution of ethnic differences in educational opportunities across cohorts. • Evaluates the ethnic gap in education in time: does it improve or persist for younger cohorts? • to compare transition matrices linking parents and offspring’s educational outcomes, between advantaged and disadvantaged ethnic groups. Also across cohorts (to observe trends). • Group comparison provides information about whether educationalmobility patterns are different between groups. • Evaluation by cohorts answers whether these mobility regimes are becoming more alike or different across time: Provides notion ofconvergence.
So we use… • We also compute the HM index comparing each ethnic group’s transition matrix with the perfect independence matrix, to have a measure of intergenerational mobility for each group (H(g)M) • indicates how far each group is from perfect independence to parental education • which group/matrix presents the major level of association between outcomes of parents and children
Cross-sectional data from national household surveys. Brazil - 1996 Pesquisa Nacional por Amostra de Domicílios (PNAD). Chile – 2006/2009Encuesta Nacional de Caracterización Socioeconómica (CASEN). Pooled data. Include parental education and ethnic identification. Limitations: PNAD: despite its informational benefits, the findings may not depict the current state of Brazilian society. Single CASEN might under-represent indigenous population (it does not recollect information in some remote regions, Agostiniet al., 2010). Pooled data will be used instead Data
Definitions • Outcome: educational attainment (parents and individuals) – for adults aged 25 years or older. • Low: complete primary schooling or less. • Medium: some secondary (incomplete or complete). • High: some higher education (incomplete or complete). • Social Group: ethnicity. • Brazil: Afro-Brazilian (40%) and White-Brazilian. Classification: self-perception. • Chile: Indigenous (6%) and Non-Indigenous. Classification: language. • Time dimension: 5 successive birth-cohorts born in ten-year spans. • Youngest [25-34] – Eldest [65+].
Brazil: How has attainment evolved? • Educational structure has improved for individuals in the sample Growth between eldest and youngest cohorts: Medium attainment: 16.5 p.p. (youngest: 21%) High attainment: 6 p.p. (youngest: 10%) However, almost 70% of Brazilians are still showing low levels of education.
And by ethnic groups? • Higher average educational attainment for both. BUT, higher relative improvement for the White-Brazilians Larger gap in youngest than in eldest cohort: Higher reduction in % in low education for WB than AB. Higher improvement in medium and high educational levels for WB than AB.
Brazil: Inequality in educational opportunities between ethnic groups and cohorts Estimates of the Heterogeneity Index of IO (C.I. with 5000 reps) Significant ethnic differences in educational opportunities. Increase in these differences between youngest and eldest cohorts. Persistent ethnic gaps in educational opportunities.
Brazil: Intergenerational educational mobility by ethnic groups & cohorts Estimates of the Heterogeneity Index for transition matrices & perfect independence matrix (C.I. with 5000 reps) Significant departure from perfect independence, though nearer in younger cohorts. AB: greater increase in mobility than WB, which leads to the same level of indep. to parental education for both ethnic groups, for the younger cohorts
Brazil: Differences in intergenerational educational mobility between ethnic groups & cohorts Estimates of the Heterogeneity index HM between transition matrices
Brazil: Differences in intergenerational educational mobility between ethnic groups & cohorts Estimates of the Heterogeneity index for transition matrices (C.I. with 5000 reps) The index is statistically different from 0 for all cohorts: the mobility patterns are different between WB and AB No statistically significant reduction of the HM between the eldest and youngest cohorts. Non-convergence in educational mobility patterns between ethnic groups.
Possible explanations for this trend Even though upward mobility has increased for both ethnic groups, it was higher for WB
Chile: How has attainment evolved? • Educational structure has significantly improved for individuals in the sample Growth between eldest and youngest cohorts: Medium attainment grew almost 24 p.p. (youngest: 53%) High attainment: 21.2 p.p. (youngest: nearly 31%) Only 17% of Chileans are still showing low levels of education.
And by ethnic groups? • Higher average educational attainment for both. BUT, higher relative improvement for the Non-Indigenous Larger gap in youngest than in eldest cohort. Much higher reduction in % in low educfor Non-Indigthan Indigenous. % in medium education increased more for indigenous, but % in high education grew 65% more for Non-Indigenous.
Chile: Inequality in educational opportunities between ethnic groups and cohorts Estimates of the Heterogeneity Index of IO (C.I. with 5000 reps) Significant ethnic differences in educational opportunities. Persistent ethnic gaps in educational opportunities.
Chile: Intergenerational educational mobility by ethnic groups & cohorts Estimates of the Heterogeneity index for transition matrices & perfect independence matrix (C.I. with 5000 reps) Significant departure from perfect independence. Similar level of indep. to parental education for both ethnic groups, for every cohort
Chile: Differences in intergenerational educational mobility between ethnic groups & cohorts Estimates of the Heterogeneity index HM between transition matrices
Chile: Differences in intergenerational educational mobility between ethnic groups & cohorts The index is statistically different from 0 for all cohorts: the mobility patterns are different between Indigenous and Non-Indigenous No statistically significant reduction of the HM between the eldest and youngest cohorts. Non-convergence in educational mobility patterns between ethnic groups. Estimates of the Heterogeneity index for transition matrices (C.I. with 5000 reps)
However, in Chile… Upward mobility has increased more for the Indigenous
Preliminary conclusions • In Brazil: • Persistent ethnic differences in educational opportunities across cohorts. • Average education improves for both groups, but the ethnic gap does not fall. • Non-convergence in intergenerational educational mobility patterns between ethnic groups across cohorts. • Association between educational achievements of fathers and sons seems to have fallen for the youngest cohorts within each ethnic group • BUT, the gap in intergenerational mobility between ethnicities remained unchanged across generations • Higher upward mobility for WB compared to AB. • These findings are suggestive of Afro-Brazilians being caught in an Educational Inequality Trap. • Similar analysis for Chile: preliminary evidence is less suggestive of EIT.
Policy discussion • Two-tiered policies for disadvantaged groups: • Short-run: Affirmative action policies and subsidies to compensate for existing ethnic disparities of present generations. • Wage subsidies, support for private businesses, preferential treatment in jobs (affirmative action). • Could be a component of social programs such as BolsaFamilia and Chile Solidario, focused directly on the disadvantaged ethnic group. • Long-run: Components to mitigate the persistence of worse outcomes for disadvantaged ethnic groups. • Endowments: foster access and quality of education. Policies to prevent dropping-out at the secondary level and increase access to the tertiary education (e.g. credit policies to overcome existing constraints).