Download
1 / 41
410 likes | 520 Views
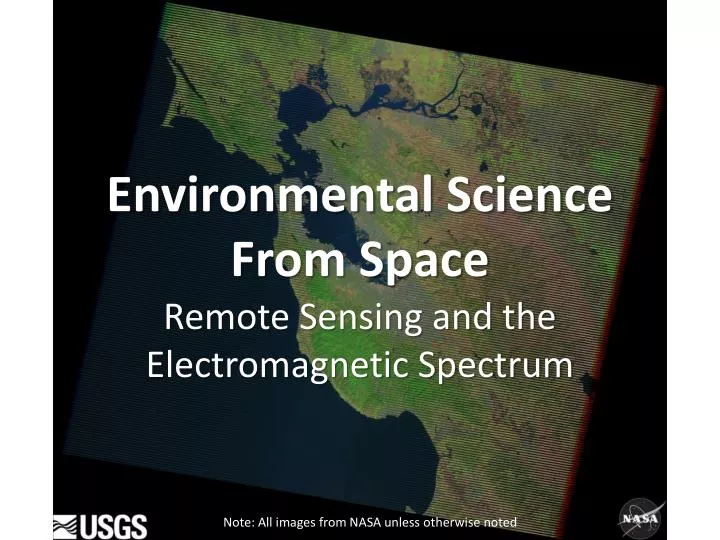
Environmental Science F rom Space. Remote Sensing and the Electromagnetic Spectrum. Note: All images from NASA unless otherwise noted. Remote Sensing. = learning about an object or phenomenon without touching, usually using satellites or airplanes.

E N D
Environmental Science From Space Remote Sensing and the Electromagnetic Spectrum Note: All images from NASA unless otherwise noted
Remote Sensing = learning about an object or phenomenon without touching, usually using satellites or airplanes http://www.nasa.gov/centers/langley/news/factsheets/RemoteSensing.html
1830s Early 1900s U-2 Spyplane at 70,000 ft – 1950s CIA Corona satellite – 1960 http://earthobservatory.nasa.gov/Experiments/ICE/Channel_Islands/tg_channelislands.php
http://www.nasa.gov/vision/earth/lookingatearth/earthweek.htmlhttp://www.nasa.gov/vision/earth/lookingatearth/earthweek.html
Videos LandSat video: http://landsat.gsfc.nasa.gov/about/ Terra orbit animation: http://earthobservatory.nasa.gov/Experiments/ICE/panama/panama_mov2.php Watch live broadcast of LandSat: http://earthnow.usgs.gov/
http://landsat.gsfc.nasa.gov/ Landsat 7 http://science.hq.nasa.gov/kids/imagers/ems/infrared.html http://ls7pm3.gsfc.nasa.gov/Science.html
Landsat 7: 7 bands 1 2 3 4 5 Watsonville 3/4/2012 6 7
2 2 3 3 4-3-2 4 4 http://landsat.gsfc.nasa.gov/
3-2-1 4-3-2 7-4-2
INFRARED http://missionscience.nasa.gov/ems/09_visiblelight.html
LandSat Spectral Signatures BUILDINGS WATER TREES ROCKS
Pixels & RGB Codes = 255,0,0 = 0,255,0 = 0,0,255 =255,255,255 = 0,0,0 = ?,?,? = 0,255,255 255,0,255 ?
ACTIVITY:Creating & Interpreting Remote Sensing Images(Derived from NASA’s Remote Sensing Math)
https://mynasadata.larc.nasa.gov/ElectroMag.html http://science.hq.nasa.gov/kids/imagers/ems/index.html
Reviewing Waves • _________________ (λ) = distance from any point on a wave to an identical point on the next wave • _________________ (f) = number of cycles or vibrations per unit of time (1 Hz = 1/s) • _________________ (v) = distance/time • __________ = _____________ * _____________ • Speed of light (c) in vacuum = 3.8 x 10⁸ m/s (186,000 miles/second)
Problem #1: Visible Light • Which color has the longest wavelength? • Which color has the highest frequency? • Which color has the highest speed? http://science.hq.nasa.gov/kids/imagers/ems/index.html
We can only see a small amount of the light that surrounds us all the time. https://mynasadata.larc.nasa.gov/ElectroMag.html http://science.hq.nasa.gov/kids/imagers/ems/index.html
Radio Waves • Carry TV, AM & FM radio, cell phone, & other communication signals • Used by radio telescopes to study radiation emitted by objects in space Carbon Monoxide (CO) gases in our Milky Way galaxy
Problem #2: Radio • What’s the frequency of your favorite radio station? • Calculate its wavelength.
Microwaves • Heat food by making molecules rotate fast • Used to detect & measure distance to objects, such as airplanes & weather, with radar sarakwatch.com http://science.hq.nasa.gov/kids/imagers/ems/micro.html
Microwaves Credit: NASA/WMAP Science Team Credit: NASA image courtesy the QuikSCAT Science Team at the Jet Propulsion Laboratory Background radiation in the universe gives clues to the Big Bang http://missionscience.nasa.gov/ems/06_microwaves.html
Infrared Waves • Heat – used to determine temperature of objects • Uses • Keeping food, spaces, animals warm (heat lamps) • TV remote signal • Firefighting • Rattlesnakes use to detect warm-blooded animals • Remote sensing • Determine temperature of land, water • Map clouds, vegetation Wikipedia • This image shows the infrared data (appearing as red) composited with visible light data at the blue and green wavelengths. If near infrared is reflected off of healthy vegetation, what do you think the red square shaped areas are in the lower left of the image? Image of Phoenix (AZ) with near infrared as red
This false-color composite of Jupiter combines near-infrared and visible-light data of sunlight reflected from Jupiter's clouds. Since methane gas in Jupiter's atmosphere limits the penetration of sunlight, the amount of reflected near-infrared energy varies depending on the clouds' altitude. The resulting composite image shows this altitude difference as different colors. Yellow colors indicate high clouds; red colors are lower clouds; and blue colors show even lower clouds in Jupiter's atmosphere. The Near Infrared Camera and Multi-Object Spectrometer (NICMOS) onboard NASA's Hubble Space Telescope captured this image at the time of a rare alignment of three of Jupiter's largest moons—Io, Ganymede, and Callisto—across the planet's face. http://missionscience.nasa.gov/ems/07_infraredwaves.html http://www.osdpd.noaa.gov/ml/ocean/sst/sst_50km.html
Infrared Imaging • What object is in the image below?
Visible Light • Only wavelengths we can see • Sources: sun, light bulbs • Uses • Human vision • Photosynthesis of plants • Remote sensing: map height of mountains, trees, clouds, etc.
Laser Altimetry (LiDAR) Where are the tallest trees? Credit: NASA Earth Observatory/Image by Jesse Allen and Robert Simmon/Based on data from Michael Lefsky. http://www.nasa.gov/topics/earth/features/forest-height-map.html Outside Davenport, north of Santa Cruz www.nps.edu/Faculty/Olsen/Student_theses/11Sep_Harmon.pdf
Problem #3: Technology • Choose one of the following devices • Bluetooth (2400 MHz) • GPS (1575.42 MHz) • Wi-Fi (5 GHz) • What wavelength is this? • What type of radiation is this? Microwave Microwave Radio Garmin.com Wikipedia
Ultraviolet Light • Causes sunburn • Partially blocked by ozone in atmosphere • Astronomers use to study stars Bees can see UV! UV image of Earth taken from Moon What a bee sees http://www.cals.ncsu.edu/course/ent591k/nectar_guide.html
Hubble Space Telescope spiral galaxy Messier_100 stars forming in the Eagle Nebula Wikipedia
X-Rays X-ray photo of a one year old girl who swallowed a sewing pin. Can you find it? • Image bones & teeth for medicine • Astronomers use to study very hot objects such as stars, supernova & black holes mosaic of several Chandra X-ray Observatory images of the central region of our Milky Way galaxy reveals hundreds of white dwarf stars, neutron stars, and black holes. Separately, the Solar and Heliophysics Observatory (SOHO) captured these images of the Sun representing an entire solar cycle from 1996 through 2006. Credit: NASA/UMass/D.Wang et al. Sun images from SOHO – EIT Consortium: NASA/ESA Because bones are dense and absorb more x-rays than skin does, shadows of the bones are left on the x-ray film while the skin appears transparent.
Gamma Rays • Sources: • Radioactive atoms • Nuclear explosions • Lightning strikes • Supernova explosions (death of star) • Black holes • Uses: • Detect spread of cancer • Kill cancer cells • Scan shipping containers for security • Detect elements on other planets
Mapping Vegetation 3-2-1 North America seasonal NDVI animation: http://www.nasa.gov/topics/earth/features/obscure_data.html Normalized Difference Vegetation Index NDVI = (NIR – Red) / (NIR + Red) 4-3-2
Problem #4: Mapping Vegetation red red • Calculate NDVI for the healthy tree. • Calculate NDVI for the stressed tree. Normalized Difference Vegetation Index NDVI = (NIR – Red) / (NIR + Red) http://earthobservatory.nasa.gov/Experiments/ICE/panama/panama_ex2.php
Vegetation Index Products Figure 1: NASA satellite image of the global biosphere in 2008 Green shading on land shows the normalized difference vegetation index (NDVI), which is strongly correlated with plant primary production. Blue shading in the oceans depicts surface chlorophyll concentrations; chlorophyll concentrations are directly related to the abundance of microscopic marine plants, or phytoplankton, and can be used to quantify marine primary production. (Courtesy of NASA Earth Observatory) • http://www.nature.com/scitable/knowledge/library/energy-economics-in-ecosystems-13254442 NASA Earth Observatory
2 2 3 3 4-3-2 4 4 http://landsat.gsfc.nasa.gov/
Activity: Remote Sensing of Barro Colorado Island NASA’s Rainforest at the Crossroads http://earthobservatory.nasa.gov/Experiments/ICE/panama/