Download

1 / 30
300 likes | 442 Views
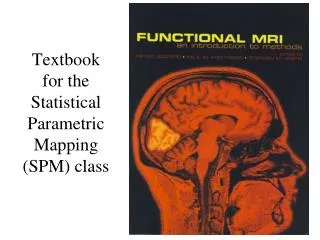
Statistical Parametric Mapping. Lecture 9 - Chapter 11 Overview of fMRI analysis . Textbook : Functional MRI an introduction to methods , Peter Jezzard, Paul Matthews, and Stephen Smith. Many thanks to those that share their MRI slides online. fMRI image example

E N D
Statistical Parametric Mapping Lecture 9 - Chapter 11 Overview of fMRI analysis Textbook: Functional MRI an introduction to methods, Peter Jezzard, Paul Matthews, and Stephen Smith Many thanks to those that share their MRI slides online
fMRI image example • array size 128x128x32 (2 mm x 2 mm x 5 mm) • FOV (256 mm x 256 mm x 160 mm) • time per point (full image volume) = 3 seconds (TR for this single shot EPI) • number of image volumes (time points) = 80 • time per session 3 sec x 80 = 240 sec ( 4 min) • 4 blocks with finger movement each followed by a block of rest ~ 30 sec each • 10 image volumes per block • BOLD signal higher during movement block • BOLD signal from brain location in primary motor area
Stimulus on 30 sec followed by off for 30 sec repeated for nine stimulus on and nine stimulus off epochs. (TR assumed = 3 sec) Figure 11.2. fMRI time series from a strongly activated voxel with visual stimulation. Signal is significantly larger than noise.
The multiple time scales in fMRI- single shot GE EPI - • time between readout data points (digitizer rate) • number of readout points determines duration • time between middle of adjacent phase encode lines • number of phase encode lines determines duration • TE which optimizes microscopic T2* signal • time between slices • number of slices determines duration • correct slices to same time throughout volume for interleaved slice acquisition (all odd then all even) • time between volumes (one per TR) • time points of interest for brain response • number of time points determines duration • time between stimulation blocks • block duration determined by needs of experiment • used in regression analysis with general linear model to determine brain activation associated with stimuli Acquisition protocol Analysis and ExperimentDesign
B1 refocus Gz Gy Gx acquire 2D Gradient Echo Echo Planar Imaging(EPI) Multi-slice volume 128x128x32 Interlaced all odd then all even slices - timing difference 1.5 sec 96 phase encode steps Time per slice (96 ms ) TE = 30 ms (time with zero phase encoding) T2* of GM ~ 50 ms (~ time of last phase encode here) Time per volume (TR = 3 sec) Readout sampling rate = 227 kHz Readout spacing = 4.4 us Pixel bandwidth = 1775 Hz Phase encode spacing = 1 ms
Pre-Processing Removes artifacts and conditions data for subsequent statistical analyses. • Calculate magnitude image from k-space data (usually done automatically by MRI system) • Slice timing correction (event related designs) • temporal interpolation of voxel time courses to same time point for each volume • Motion correction • rotation and translation to align each image volume (rigid body transform) • Noise reduction • spatial smoothing (remove noise but preserve anticipated activations) • Value normalization • adjust each image volume to have same mean value • Temporal filtering • high-pass to remove baseline shifting • low-pass to reduce random noise further
For short duration epochs of 10 seconds or less slice timing correction is important.
Temporal translation requires interpolation. Here TR = 3 sec. All odd slices were acquired first (0-1.5 sec) followed by the even slices (1.5-3.0 sec), so adjacent slices were sampled 1.5 seconds apart.
For long duration epochs such as the 30 second blocks in our finger tapping example slice timing differences are comparatively small (1.5 sec) so correction not absolutely necessary. Shifting the model uses separate models for even and odd slices, which is not preferred.
Pre-Processing • Calculate magnitude image from k-space data (usually done automatically by MRI system) • Slice timing correction • temporal interpolation of voxel time courses to same time point for each volume • Motion correction • rotation and translation to align each image volume (rigid body transform) • Noise reduction • spatial smoothing (remove noise but preserve anticipated activations) • Value normalization • adjust each image volume to have same mean value • Temporal filtering • high-pass to remove baseline shifting • low-pass to reduce random noise further Removes artifacts and conditions data for subsequent statistical analyses.
linear displacement (mm) scan or volume number Figure 11.6 (bottom)
0.01 radians ~ 0.57 degrees 1 degree ~ 0.017 radians angular displacement (radians) http://www.fmrib.ox.ac.uk/analysis/research/mcflirt/ scan or volume number Figure 11.6 (top)
Pre-Processing • Calculate magnitude image from k-space data (usually done automatically by MRI system) • Slice timing correction • temporal interpolation of voxel time courses to same time point for each volume • Motion correction • rotation and translation to align each image volume (rigid body transform) • Noise reduction • spatial smoothing (remove noise but preserve anticipated activations) • Value normalization • adjust each image volume to have same mean value • Temporal filtering • high-pass to remove baseline shifting • low-pass to reduce random noise further Removes artifacts and conditions data for subsequent statistical analyses.
Spatial Filtering Before spatial filtering. After spatial filtering. Figure 11.7. 2D or 3D spatial filter to improve SNR but preserve anticipated activations. To do this recommend that FWHM of filter to be smaller than activation extent. Here FWHM of Gaussian filter is 5 mm. Issues with differences in pixel and slice spacing for index (not mm) based filters. Suggestion: Use 2D filter to match the averaging introduced by thick slices.
Pre-Processing • Calculate magnitude image from k-space data (usually done automatically by MRI system) • Slice timing correction • temporal interpolation of voxel time courses to same time point for each volume • Motion correction • rotation and translation to align each image volume (rigid body transform) • Noise reduction • spatial smoothing (remove noise but preserve anticipated activations) • Value normalization • May adjust each brain volume to have same mean/median value (required for multi-subject studies) • Temporal filtering • high-pass to remove baseline shifting • low-pass to reduce random noise further Removes artifacts and conditions data for subsequent statistical analyses.
Pre-Processing • Calculate magnitude image from k-space data (usually done automatically by MRI system) • Slice timing correction • temporal interpolation of voxel time courses to same time point for each volume • Motion correction • rotation and translation to align each image volume (rigid body transform) • Noise reduction • spatial smoothing (remove noise but preserve anticipated activations) • Value normalization • adjust each image volume to have same mean value • Temporal filtering • high-pass to remove baseline shifting • low-pass to reduce random noise further Removes artifacts and conditions data for subsequent statistical analyses.
Temporal Filtering Figure 11.8. Time course of “single voxel” before temporal filtering (top) and after high-pass filtering and overlaying of the expected time course model. High-pass filtering removes low frequency non-physiologic modulation of activations in this example. Baseline was restored in this example.
Statistical analysis of activation images • “univariate analysis” - analyze each voxel’s time course independently • “multivariate analysis” - incorporates spatial relationships with temporal analysis • “model-based analysis” - a model of expected response is compared with the data • “model-free analysis” - effects of interest searched for based on other criteria (i.e. statistical independence of spatial or temporal components).
General Linear Model (GLM) [nx1] [nx1] [nx1] [nx1] • y(t) measured signal from a voxel at time t. • x(t) predicted model of stimulus signal (with HRF correction). • c model constant. • e(t) error between the model and measured data. • unitless parameter indicating how changes in y(t) relate to changes in x(t) (i.e. dy/dx = ). n number of images. • t n x dt where dt is the time between images (TR for EPI). Seek best fit between modeled and measured signals for “each” voxel. Regression analysis. should be high in voxels activated by stimulus and low in others.
General Linear Model (GLM) Model equation with two predicted stimulus time courses. Time is left off here to simplify the model equation. 1 and 2 parameters indicate how changes in models x1 and x2 relate to changes in the measured signal y. Assumes that dy/dx1 = 1 and similarly dy/dx2 = 2. The model variables x1 and x2 are often called “explanatory variables” or EVs. The ratio of s gives relative predictive power of the EVs. Seek best fit between modeled and measured signals for each voxel. Multiple regression analysis.
General Linear Model (GLM) • Multiple regression assumptions • linearity of relationships • Explanatory variables are independent • the same level of relationship throughout the range of the explanatory variables ("homoscedasticity"), i.e. beta is constant. • variables can be continuous • absence of outliers • data whose range is not truncated (unnaturally). • The model being tested must be correctly specified. • The exclusion of important causal variables or the inclusion of extraneous variables can markedly change beta and error values and hence the interpretation of the importance of the explanatory variables. • cross-product terms can be used to study interactions
HRF area = 1 x(t) t Figure 11.3. Square wave pattern of stimulation (solid) and predicted response x(t) (dots) after convolution with a hemodynamic response function (HRF) model. The model has both delay and smoothing effects. Note the similarity to the measured response from Figure 11.2 (lower right) except for noise. The predicted stimulation waveforms run from -0.5 to +0.5, but we can run them from 0 to 1 without a problem since the GLM constant can account for baseline offset of the data.
Data from Figure 11.3 is sometimes displayed graphically as an image with time increasing from top to bottom and signal level increasing from left to right. For each time point (row) the graphic image brightness represents the signal level. The expected signal is called the explanatory variable or EV. This is x(t) in the GLM equation. When using more than one EV a “Design Matrix” simplifies representation.
DESIGN MATRIX Figure 11.4. Example of “design matrix” with two explanatory variables (each predicted from stimulus pattern convolved with the HRF). EV 2 EV 1 [nx1] [nx1] [nx1] [nx2] [2x1] 2 = the number of EVs (explanatory variables) n = the number of time points (fMRI images) “c” can be included in the design matrix.
EV 1 EV 2 EV 3 Figure 11.5. Modeling of an interaction between stimuli. EV 1 and EV 2 model separate stimuli, while EV 3 models the interaction, i.e. accounts for the response when both stimuli are applied together. Interaction is assumed to be present.
EV 1 EV 2 EV 3 EV 4 EV 5 EV 6 EV 7 EV 8 Figure 11.9. The model (design matrix) used in the GLM analysis of the heat-warm experiment. EVs 1 and 5 model pain and warm. EVs 3 and 7 model conditioning to pain and warm. Even EVs are temporal derivatives; used to allow phase shifting during fitting (details later chapter).
Statistical Parametric Map Figure 11.12. Significant differences between two subject groups in the pain-warm contrast study.
Figure 11.11. (Bottom) Mean of 18 subjects high-resolution 3D images following alignment with the MNI-152 template (top). fMRI volumes are transformed to the template so overlaying SPM can be done since both experience same align blurring.
Figure 11.10. Stages in the rendering of activation onto a high-resolution structural image. 3D surface with activation volume in red produced by Mango.
FSL slides help with these basic concepts seeGLM.pptatwww.fmrib.ox.ac.uk/fsl/