Download
1 / 32
320 likes | 417 Views
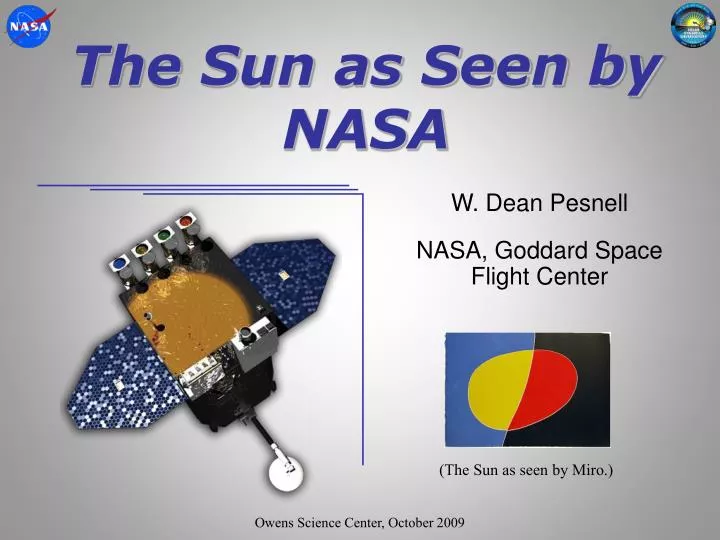
The Sun as Seen by NASA. W. Dean Pesnell NASA, Goddard Space Flight Center. (The Sun as seen by Miro.). Eddy, 1976, Science, 192, 1189. Why Study the Sun?. Wilma, October 2005. Heat from the Sun creates hurricanes and thunderstorms.

E N D
The Sun as Seen by NASA W. Dean Pesnell NASA, Goddard Space Flight Center (The Sun as seen by Miro.) Owens Science Center, October 2009
Eddy, 1976, Science, 192, 1189 Why Study the Sun? Wilma, October 2005 Heat from the Sun creates hurricanes and thunderstorms In 1976 Eddy noticed a Little Ice Age at the same time as low solar activity. Are the two related? Why was the Earth hot for the dinosaurs? Owens Science Center, October 2009
White Light White light, which means no filters, can be used to study sunspots (or active regions) and eclipses. This is one of the largest active regions ever recorded. The Earth is approximately the size of the blue dot. From the SST on La Palma, the clearest, almost-true-color, picture of an active region. Owens Science Center, October 2009
Sunspots in 2001 by MDI on SoHO Owens Science Center, October 2009
Modern Physics When you look closely you can see dark lines seen against the bright rainbow of sunlight. These lines led to modern physics and many things we use today (such as lasers and computers.) Ca II Na H The Sun is bright enough to take pictures in these lines. This shows us what each element is doing. Owens Science Center, October 2009
A Picture in H The Sun in H on October 27, 2005. No sunspots were on the Sun. Note the bright areas along the edges of the Sun. These are prominences just beyond that edge. The dark line is a filament (prominence from the top.) Photo by Greg Piepol, Rockville, Maryland Owens Science Center, October 2009
Here is a picture of a prominence on the limb of the the Sun using an Hcoronagraph in September 2005. The Earth is for scale. Owens Science Center, October 2009
Magnetic Fields A spectral line of iron at 630.2 nm can be used to measure the magnetic field of the Sun from the ground. These telescopes can’t see the Sun at night. SDO will continually measure the magnetic field, allowing us to predict when the Sun will affect spacecraft and society. Light areas are magnetic field directed toward us, darker pointing away from us. Owens Science Center, October 2009
Three Views of the Sun Magnetic field, Ha, and Ca II K images from 1/19/2004. The large prominence in Ha is missing in the other two images. Data of many forms is needed to understand the Sun. Owens Science Center, October 2009
Seeing Inside the Sun Helioseismology uses sound to see into and through the Sun-like thunking a watermelon The velocities under a sunspot show that material moves toward the spot near the surface and away from the spot lower down. Right: Farside images show the active regions that launched the largest flares ever measured. We can see them on our side at top, continuing around the Sun in the middle and re-appearing at the bottom. The middle view is two weeks after the top and the bottom two weeks later. Owens Science Center, October 2009
Telescopes in Space SMM (NASA) SOHO (NASA & ESA) Stereo (NASA) Yohkoh (NASA & JAXA) SORCE (NASA) Owens Science Center, October 2009
Telescopes in Space He I 304 Å from SOHO (50,000 K) TRACE loops (roughly 1 million K) From space we can see light in UV and X-rays that is absorbed by the Earth’s atmosphere. The loops and swirls are created by material moving along magnetic fields. Owens Science Center, October 2009
“Seeing” Magnetic Fields Data from the EIT on SOHO shows the complexity of the solar magnetic field. The changes from solar minimum (left) to near solar maximum (right) are also visible. Owens Science Center, October 2009
CMEs Owens Science Center, October 2009
LASCO Coronagraph on SoHO shows CMEs during the October 2003 storms Owens Science Center, October 2009
LASCO Coronagraph images showing 2 comets striking the Sun Owens Science Center, October 2009
Another set, showing Jupiter, Saturn, Mercury, and Venus Owens Science Center, October 2009
What You Can Use Sunspotter Solar Telescope, $300 Coronado Personal Solar Telescope, H and Ca K, $500 Coronado MaxScope 70, $3000 Baade Front Filter, $80 Owens Science Center, October 2009
What You Can Do Look for comets with SOHO Study the Wilson effect Look at light bridges Watch for flares in H Look at prominences Count sunspots Data from the National Solar Observatory Data from NASA satellites, SOHO, Trace, SDO (after launch), and others Data can be freely used, but check each site for how to say thank you and how to confirm your Nobel prize winning discovery. Owens Science Center, October 2009
Sundogs are another thing to look for in the daytime sky. They are formed by ice crystals in the atmosphere. This was seen in France on Sept. 20, 2005. Owens Science Center, October 2009
Thanks! The Solar Dynamics Observatory, the first mission of Living With a Star, will provide the data needed to understand the solar convection zone and how magnetic field is assembled and dissipated in the solar atmosphere. SDO is at the Cape, ready to GO! (more tomorrow) http://sdo.gsfc.nasa.gov Owens Science Center, October 2009
Summary The Sun can be seen in many ways, and changes with time in all of them. The Sun’s magnetic field waxes and wanes with the solar cycle. As the Sun changes so does its ability to affect spacecraft and society. You can observe the Sun yourself, with easily-purchased equipment, or use data from NASA and NSF telescopes. SDO will measure the Sun’s light output and magnetic field, allowing us to predict when the Sun will affect spacecraft and society. Owens Science Center, October 2009
Telescopes in Space Three images taken in May 1998 by EIT on SOHO make up this false-color image. Images in Fe IX-X 171 Å (blue), Fe XII 195 Å (green) and Fe XV 284 Å (yellow) were combined into one that reveals solar features unique to each wavelength. The magnetic structures in the corona are clearly traced in these images. Where and how those fields are created and destroyed is why we still study the Sun. Owens Science Center, October 2009
Telescopes on the Ground Dutch Open Telescope, la Palma Swedish Solar Telescope, La Palma McMath Solar Telescope, Kitt Peak Owens Science Center, October 2009
Come outside and see Mars at its closest approach! Owens Science Center, October 2009
Wanted, Day or Night: the Sun WARNING: The Sun is armed with very intense light. Approach with caution. Never look directly at the Sun without protection. Active Active Quiet Diameter: 1.4 million km (0.86 million miles, 110 Earth diameters) Mass: 2 1030 kg (2 nonillion kg, 330,000 times the Earth) Energy output: 4 1026 W (0.4 octillion W) Surface Temperature: 5770 K (10,420 ºF) Last Known Location: 150 million km (93 million miles) away AKA: Old Sol, Die Sonne, Soleil, Sunce, Inti, Re, UTU, Helios SOHO/MDI 2004/07/20 Rz = 176 2004/07/09 Rz = 17 Vital Stats Owens Science Center, October 2009
Sunspot Number Drawings and photographs of the Sun can be combined to create the longest record of solar activity, the Sunspot number, which runs back to the 1600’s. The Maunder minimum corresponds to low sunspot number and low temperatures on the Earth. Research continues into how solar activity affects the Earth’s climate. Owens Science Center, October 2009
Other Resources • Sun-Earth Connection: http://sec.gsfc.nasa.gov • Living With a Star: http://stargazers.gsfc.nasa.gov • “Our Very Own Star: The Sun:” http://stargazers.gsfc.nasa.gov/epo/resources/Sun_booklet_English.htm • Solar Dynamics Observatory: http://sdo.gsfc.nasa.gov • Solar Heliospheric Observatory: http://soho.nascom.nasa.gov • Today’s Space Weather: http://www.spaceweather.com • Space Weather Data: http://sec.noaa.gov Owens Science Center, October 2009
Contact Information • W. Dean Pesnell: William.D.Pesnell@nasa.gov Owens Science Center, October 2009
What Spectral Lines Say Because it is bright, the Sun has played a major role in developing how to use spectral lines in physics. When a spectral line is measured, each piece of information tells us something. • Presence composition • Size temperature and brightness • Location velocity • Polarization magnetic field A copy of a plate from an article by G. E. Hale in The Astrophysical Journal (49, 153, 1919). Shows how the magnetic field of the sunspot make the line visibly thicker. Owens Science Center, October 2009