Download
1 / 26
260 likes | 349 Views
The Sun as a whole: activity as seen by helioseismology. A.C. Birch (Max Planck Institute for Solar System Research). Low degree (ell = 0, 1, 2) mode frequencies change with the solar cycle ( BiSON data). Red = Scaled 10.7cm flux. shift 0.01% of mode frequency.

E N D
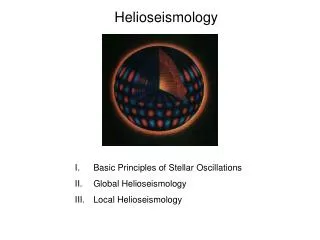
The Sun as a whole: activity as seen by helioseismology A.C. Birch (Max Planck Institute for Solar System Research)
Low degree (ell = 0, 1, 2) mode frequencies change with the solar cycle (BiSON data) Red = Scaled 10.7cm flux shift 0.01% of mode frequency From Anne-Marie Broomhall
Ok. But why?What else can be measured? • Dependence on mode parameters: • Frequency (upper turning point) • Angular degree (lower turning point) • Other mode properties: • Damping rates • Amplitudes (energy input rate) • Flows: • Differential rotation / zonal flows (Global helio.) • Meridional circulation (local helio.) • 3d flows (local helio.)
Outline • Cycle variations of mode parameters • Flows associated with the cycle • Future directions
Libbrecht and Woodard (1990, Nature) BBSO data, angular degree up to 140 Reminder: 1986 is cycle min., 1988 cycle beginning
Cycle dependence changes with frequency(Libbrecht & Woodard, 1990)
Latitude inversion of frequency shifts(Libbrecht & Woodard, 1990) Solid Line = inversion of even splittings (m dependence) Squares = limb brightness Dashed line = limb brightness same resolution as inversion result
(medium-ell) frequency changes come from latitudes of activity Figure from R. Howe, method of Howe et al. (2002), GONG data
Frequency dependence of low degree modes Cycle 22 Cycle 23 Cycle 24 Black=average frequency shift Red=10.7cm flux Blue=ISN What is going on? Claim: change in the range of depths where the solar-cycle changes are happening Anne-Marie Broomhall Basuet al. (2012)
High-ell mode frequencies vary with the solar cycle also (MDI dynamics) Spring-2001 (near max) Fall-2001 (near max) 1996 (min.) More complicated than a simple surface term MPSI = ``magnetic plage strength index” Physics? Rhodes et al. (2014)
Interpretation • An extensive and rich literature • Physical origin of frequency changes: • Changes in (MHD) turbulence near the surface (e.g., Goldreich et al. 1991, Dziembowski et al., 2001) • Changes in magnetic field in chromosphere (e.g. Jain & Roberts, 1993) • Changes in subsurface structure (e.g. Baldner & Basu, 2008) • General agreement (I think) that thermal effects alone are not enough (Balmforth et al. 1996) (the above are not mutually exclusive)
A point to remember: energy input doesn’t change! Mode amplitude Damping rate Energy input Mode power Salabert & Jimenéz-Reyes (2006, LOWL data)
Zonal flows vary with the cycle GONG data Ring diagram measurements Red = fast rotation Blue = slow rotation Scale is +/- 25 m/s Black contours = |B| Polynomial fit removed at each time Fast on equatorward side of activity. Appears before (large scale) activity. Komm et al. (2013)
Meridional circulation varies with the cycle GONG data Ring diagram measurements Red = Northward Blue = Southward Scale is +/- 25 m/s Black contours = |B| Convergence toward active latitudes Komm et al. (2013)
Active regions have near-surface inflows Cooling drives inflows into AR: Spruit 2003 Gizon, Spruit, Birch 2010
Flows before and during active region emergence(w/ Schunker, Braun) • HMI/SDO observations • Identify active regions that emerge into relatively quiet Sun • Make surface flow maps using helioseismology • Look at flows after averaging over 60 emergening active regions
Average over AR B contours at 50, 100, 150 G
Zoom in t = 34 hr AR Max. flow 150 m/s Inner circle: 30 Mm radius Contours = |B| at 50, 100, 150 G
Future directions • Connect global and local helioseismic measurements of the cycle: • Global modes: sunspots + plage + ? • Local helio: can potentially sort it out • A related point: • Geometry matters (even at ell=1). • Models (I think) need to take care of horizontal and vertical variations to understand cycle differences. • High ell mode frequencies are now available. This is an opportunity.
Average over AR Converging flow! Note offset.
Zoom in t = -13 hr AR Max. flow 100 m/s Inner circle: 30 Mm radius