Download
1 / 21
210 likes | 289 Views
PERFORMANCE OF THE DELPHI REFRACTOMETER IN MONITORING THE RICH RADIATORS. A. Filippas 1 , E. Fokitis 1 , S. Maltezos 1 , K. Patrinos 1 , and M. Davenport 2 1) NTU-Athens 2) CERN. OUTLINE. RICH detector of DELPHI Experimental setup Data analysis method Experimental results Conclusions.

E N D
PERFORMANCE OF THE DELPHI REFRACTOMETER IN MONITORING THE RICH RADIATORS A. Filippas1, E. Fokitis1, S. Maltezos1, K. Patrinos1, and M. Davenport2 1) NTU-Athens 2) CERN
OUTLINE • RICH detector of DELPHI • Experimental setup • Data analysis method • Experimental results • Conclusions
The influence of the refractive index n • The Ring Imaging CHerenkov detector (RICH) of DELPHI experiment, allows the charged particle identification by measuring the Cherenkov angle. • The refractive index n, is a fundamental parameter for the determination of the particle velocity β, according to the well known formula : An experimental uncertainty of θc corresponds to a variation of n-1, which is approximately :
The need of stability of the RICH gas radiators • The variation of the refractivity (n-1) must be less than that corresponding to the experimental error of θc,during the data taking. • The stability of the refractivity, depends on pressure, temperature, and purity of the gases. • Frequent monitoring of n-1 is useful to prevent systematic errors in the data analysis.
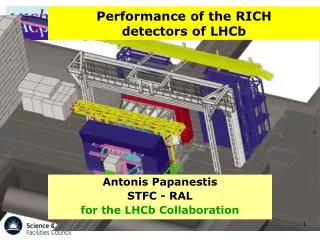
EXPERIMENTAL SETUP • The pressure tunable Fabry-Perot refractometer (FPR), installed at the DELPHI RICH detector at CERN, is able to monitor the refractivity (n-1) of the gas radiators (C5 F12 and C4 F10 ) in the VUV range. • It has been upgraded since 1996, by using a Pt-Ne spectral lamp, improved alignment and temperature controllers. • The determination of n-1 is being by using a specific analysis of the recording interferometric data.
Measurement procedure • The gas samples are introduced into transfer bottles at different conditions for the two types of gases (700 hPa/40 o C and 1100 hPa/22 o C respectively). • An interferogram is obtained during the gas pressure variation. • The measurement procedure is controlled by a specific on-line software, running in a personal computer (PC-486).
The main optical components • A Pt-Ne hollow cathode lamp is used as a light source, because it has strong and coherent emission lines at photon energies down to 7 eV (~177 nm). • An optical interference filter, with transmittance peaking 34 % at 185 nm, is used to select the desired spectral range. • A Photomultiplier, sensitive in the range 150-320 nm, is used for recording the intensity variation of the central interference fringe.
DATA ANALYSIS METHOD • The initial aim of the data analysis, is to obtain the experimental reconstructed spectrum of the lamp. This is done analyzing the recorded data by the “finite Discrete Fourier Transform (f-DFT)”. As a result, the reconstructed spectrum of the lamp is obtained. • A simulation software of the refractometer is written in order to produce simulated data. In this technique, we take into account mainly the doppler broadening effect and the “etalon” mirror imperfections (i.e. rms flatness). From the comparison of the experimental spectrum with the reconstructed one, we achieve the peak identification.
How extracting the refractivity • For a particular peak at wavelength λο in the reconstructed spectrum, the refractivity is extracted using the following expressions : Where, N is the total number of fringes and fav the average frequency in units of : fringes per pressure unit. P is the final pressure and d the “etalon” spacer thickness used in the FPR.
Determination of the number of the fav • A gradual increase of the frequency during the recording, is due to the “non-ideal gas” nature of fluorocarbons. • As a result, the recording interferogram is a beat consisting from a certain number of slightly increasing frequency components. • A particular frequency fav can be approximately determined, as the mean frequency of the corresponding peak profile, according to the Woodword’s theorem [Telecom. Research Establ., England, memo. 666, 1952].
Noise reduction technique • A cross-correlation between two successive interferograms is applied, in order to eliminate the uncorrelated components of the noise. • Additionally, we introduce the criteria of frequency coincidence and maximum phase margin, in order to reject more random noise. • Improved values of signal-to-noise ratio, have been achieved in the cases of low signal detection in VUV (down to 180 nm).
Experimental errors The quantities mainly affecting the accuracy are λo, fav, d, and P. • The λo and fav uncertainty depends on the power spectrum resolution. • The errors of d and P are less than 0.5 %. • The absolute temperature variations are only +0.1 % with negligible contribution to n-1 error. • The non-linearity of the pressure sensor is 1 % but the influence on the n-1 error is less than 0.1 %. • The estimated overall standard errorof n-1, in the range 180-220 nm, is : δn/(n-1)=1.0 ~ 1.2 %
EXPERIMENTAL RESULTS DURING 1996-99 • The evolution of C5 F 12 and C4 F 10 refractivity during 1996-99 period, measured by the DELPHI refractometer. • The determination of the mixing ratio of nitrogen into the gas radiator of BRICH. • The refractivity of the vapors of C6 F 14 measured by the DELPHI RICH refractometer.
The obtained reconstructed spectra The fitted dipsersion curves are shown below :
Nitrogen mixing percentage determination • Measurements of C5 F 12 from input and output of Barrel RICH have been taken systematically under conditions of 1030 hPa/40 oC. • The nitrogen (N2) percentage into the radiator have been calculated by the formula : • where no and ni are the refractive indices in the output and input correspondingly. The obtained value was :
Refractivity results of C6 F14in gas phase • Vapors of C6 F 14 have been introduced in the refractometer and the refractivity has been measured at two wavelengths. • The obtained values extrapolated at 1030 hPa/40 o C were the following : • These values are consistent with that obtained with own “Prism Refractometer” in liquid form and converting to a value for the gas form.
CONCLUSIONS • Monitoring of the refractivity of the gas radiators was made systematically by the refractometer, during the last 4 years. • We have not observed an appreciate systematic variation of refractivity during the mentioned period. • Due to the high sensitivity of the refractometer, down to ~0.5 %, some unwanted mixing between the gases, can detected successfully. • For the first time, he refractivity of the liquid radiator C6 F 14 ,in gas phase, has been measured with a certain accuracy.