Download
1 / 40
510 likes | 746 Views
Fixed Area Plots and Plot Boundaries Fixed Area Plots Slope Correction Stand Boundaries Strip & Line-Plot Cruising Permanent Plots. FOR 274: Forest Measurements and Inventory. Fixed Area Plots: Overview.

E N D
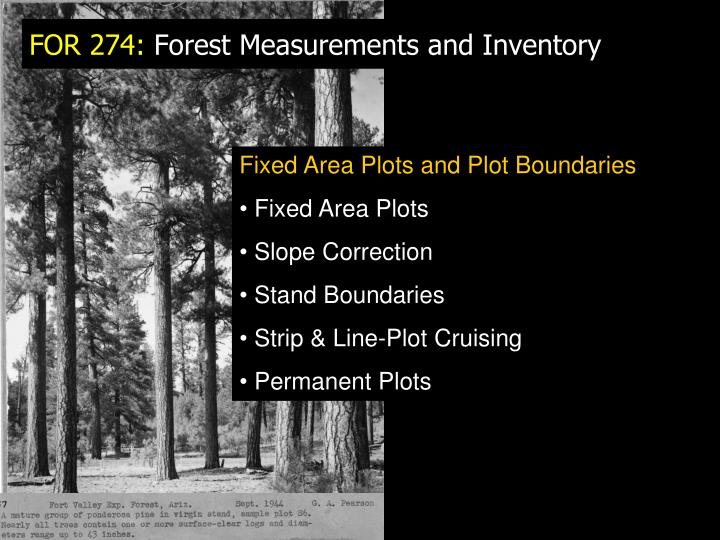
Fixed Area Plots and Plot Boundaries • Fixed Area Plots • Slope Correction • Stand Boundaries • Strip & Line-Plot Cruising • Permanent Plots FOR 274: Forest Measurements and Inventory
Fixed Area Plots: Overview Plot: Small area sampling unit that are normally a square, rectangle, or circle Strip or Transect: Rectangular plot that’s length is very much greater than its width Individuals are selected by probability proportional to frequency (the more common it occurs the more likely it is measured) Fixed Area x
Fixed Area Plots: Common Sizes Source: Husch Beers and Kershaw
Fixed Area Plots: Example You are asked to conduct a forest inventory for the USFS using 1/17th acre plots. Assuming flat ground, what is the plot’s radius? Area = πr2 Area of acre = 43,560 ft2 Area of 1/17th acre = 43,560/17 = 2,562 ft2 Area = 2,562 ft2 = πr2 r2 = 2, 562 / π = 815.6 r = √(815.6) = 28.6 ft
Fixed Area Plots: Example Area = πr2 sor = √(Area / π) To remember acre area: 1/10 acre plot is a 66 x 66 ft square. So Acre = 66*66*10 = 43,560 ft2
Fixed Area Plots: Example You do a cruise for a Canadian landowner who wants an inventory based on 6th hectare plots Assuming flat ground, what is the plot’s radius? Area = πr2 Area of a hectare = 10,000 m2 Area of 1/6th hectare = 10,000/6 = 1,666 m2 Area = 1,666 m2 = πr2 r2 = 1,666 / π = 530.5 r = √(530.5) = 23.0 m
Fixed Area Plots: Example Area = πr2 sor = √(Area / π) To remember hectare area: 1 hectare plot is a 100 x 100 m square.
Fixed Area Plots: Square and Rectangular Plots • Why: • Easier to determine if trees are “in” or “out” of plots • Rectangular plots used in natural forests with complex topography – orientated up-slope to capture most variability • Problems: • If rectangles are too long strip sampling: low number of plots sampled
Fixed Area Plots: Circular Plots • Why: • The radius defines the size and therefore what is in the plot • Easy to set-up • No pre-determined orientation – rectangular plots can lead to significant bias • Problems: • Errors at boundaries • It is not possible to do a 100% inventory • Difficult to correct for slope – have to use an ellipse
Fixed Area Plots: Good Practices • The Steps to Setting up Fixed Radius Plots: • Place rebar at plot center – or flag branch or nearest tree to plot center • GPS Plot Center if you have one – or measure bearing and distance to a recognizable feature • Lay out 2 x 100 foot tapes in a cross going N-S and E-W intersecting at the plot center • Place flagging at each of the N,S,E,W ends • Start at North line and measure trees in a clockwise direction
Fixed Area Plots: Sub Plots In natural forests there are more small DBH trees than large DBH trees. Therefore, in fixed area plots you usually will measure more small trees than large ones How would we change our design to measure more large trees?
Fixed Area Plots: Sub Plots Solution: Use nested plot design Nested Plot Design: Increasing size classes are measured in plots of increasing area Example: 1/5th acre plot for large DBH trees (sawtimber) 1/10th acre plot intermediate DBH trees (pulpwood) 1/100th acre plot for small DBH trees (regeneration) x
Fixed Area Plots: Nested Plot Designs Example: Forest Inventory Analysis Phase 2 – One site every 6,000 acres. Field crews collect data on forest type, site attributes, tree species, tree size, and overall tree condition on accessible forest land. Phase 3 – One plot every 96,000 acres. These attributes include tree crown conditions, lichen community composition, understory vegetation, down woody debris, and soil attributes.
Fixed Area Plots: Nested Plot Designs Example: Fire Effects Monitoring Hudak et al 2007 - JFE
Circular Plots: Slope Correction • On sloping ground, plots have an oval shape with their long axis parallel to the slope (called the “slope fall line”). • Note that a line perpendicular to the slope forms a “right angle” with the slope fall line. • Plots on sloping ground need to have their radius adjusted using a factor that converts slope distance to what is called horizontal distance.
Circular Plots: Slope Correction To adjust the radius (on the slope) we use trig: HD = SD * cos ά Therefore: SD = HD / cos ά Example: 1/10 ac plots, slope of 25° Radius on Slope = 37.2 / cos ά = 41.4 ft (not 37.2!)
Circular Plots: Slope Correction Generalized corrections when adjusting for slope. Example: 1/10 acre plot on 35% slope: No slope radius = 37.2 feet Short axes (perpendicular to slope) = 37.2 feet Long axes (parallel to slope) = 37.2 * 1.06 = 39.4 feet
Fixed Area Plots: Stand Boundaries • What issues do edge plots cause? • Plots for which the plot center is outside the boundary will not be measured. So, trees close to the boundary are less likely to be sampled and are under-represented. • Portions of our plots may land outside the population. If we count such plots as being full-sized, we bias our statistics. • Why might the edge trees differ from the central trees?
Fixed Area Plots: Stand Boundaries • Edge trees can exhibit: • Less competition • More wind impacts
Fixed Area Plots: Stand Boundaries Fixed Area Plots: Stand Boundaries Solution 1: Ignore it. When large stands are cruised with small circular plots – the bias can be considered negligible But when cruised tracts are narrow and long – i.e. more likely to have edge plots there are several methods that can be used
Fixed Area Plots: Stand Boundaries • Solution 2: Move plot so it falls within boundary • Worst Method! • Edge trees will be under sampled • Can lead to significant bias if stand has lots of edges! Source: Husch Beers and Kershaw
Fixed Area Plots: Stand Boundaries • Solution 3: Add additional radius to account for lost area • Intermediate Method • Edge trees will be under sampled Source: Husch Beers and Kershaw
Fixed Area Plots: Stand Boundaries • Solution 4: Re-calculate area and only measure within stand • Intermediate Method • Very time consuming as need to infer samples under correct areas Source: Husch Beers and Kershaw
Fixed Area Plots: Stand Boundaries • Solution 5: Establish exactly half a plot at the stand edge Then double count • Intermediate Method • Edge trees will be over sampled leading to bias Source: Husch Beers and Kershaw
Fixed Area Plots: Stand Boundaries • Solution 6: Mirage Plots • Intermediate method • Lay out your plot and measure all the “in” trees • Imagining the stand edge a mirror, lay out the mirror image of your plot with the plot centre outside the stand and measure the “in” trees • Edge trees will be over sampled leading to bias
Fixed Area Plots: Stand Boundaries • Solution 7: Don’t Place a Plot at the edge in the first place! • Use Buffers around edges, roads, and rivers • Biases against edge trees
Fixed Area Plots and Plot Boundaries • Fixed Area Plots • Slope Correction • Stand Boundaries • Strip & Line-Plot Cruising • Permanent Plots FOR 274: Forest Measurements and Inventory
In strip cruising, parallel strips (long thin rectangular plots) are used where the spacing between the steps are constant • Advantages: • Continuous sample • Travel time is low (as compared to visiting randomly located plots) • Strips have fewer boundary trees • Disadvantages: • Errors easily introduced if correct strip width is not maintained • Need at least 2 people • Brush, windfalls, and surface debris are more of a hazard (as cruisers must cruise along a fixed compass bearing) Fixed Area Plots: Strip Cruising
Fixed Area Plots: Strip Cruising • Notes: • Decrease width in young stands with high stem count • Increase width in more scattered high value timber • Cross drainages at right angles • In theory all timber conditions are samples and a representative sample taken • Sampling intensity = (W/D)*100 Source: Avery and Burkhart Chapter 10
In line-plot cruising the plots are equally separated on each line, with equal spacing between each line – i.e. a grid • Advantages: • Can be cruised by 1 person • Cruisers less hindered by brush and windfall • The “pause” at plot center enables better checking of borderline trees • Quick data summaries can be obtained per plot or by stand / condition classes. Fixed Area Plots: Line-Plot Cruising
In line-plot cruising a systematic tally of timber is taken from plots laid out on a grid pattern Fixed Area Plots: Line-Plot Cruising Source: Avery and Burkhart Chapter 10
Notes: • Circular ¼ and 1/5 ac plots commonly used for timber tallies • 1/10 ac for pulpwood trees • 1/100 ac for regeneration counts Fixed Area Plots: Cruising Source: Avery and Burkhart Chapter 10
Fixed Area Plots: Cruising • Notes: • Planned on a % cruise basis, where each plot “represents” an area: 4 chains x 5 chains = 2 ac • Sampling Intensity = plot size / represented area = 0.2/2 = 10% Source: Avery and Burkhart Chapter 10
Advantages of Strip (over Plot) Cruising: • Sampling is continuous • Low travel time between plots • Strips have fewer borderline trees than plot cruising • Need two people to cruise – so safer in remote or dangerous regions Fixed Area Plots: Cruising Source: Avery and Burkhart Chapter 10
Disadvantages of Strip (over Plot) Cruising: • The cruiser often misses borderline trees by poorly estimating the width of the strip • Brush, windfalls, fire damage etc get in the way • Difficult to repeat as the center line is rarely recorded Fixed Area Plots: Cruising Source: Avery and Burkhart Chapter 10
Permanent plots (that are re-measured) provide statistically strong ways to evaluate changes • 2 separate sets of random samples in a stand will have higher measurement errors that measuring the same plots twice. • Measuring changes in the same place allows actual changes to be recorded • Faster to obtain second inventory as general location of plots are known • Requirements: • Plots must be representative of stand / forest conditions • Plots must be subjected to the same treatments as the non-sampled parts of the forest Permanent Plots: CFI and SBI
Continuous Forest Inventory (CFI): Has been around since the 1950s. Involves permanent fixed plot centers – the same trees are measured over time to obtain growth and yield estimates. CFI is good at estimating volumes at the Area and State-wide endowment (IDL) level. Stand Based Inventory (SBI): Managers recognized the need for an inventory that provides reliable estimates of volume at the stand level. SBI plots are installed by stand at a level of 1 plot per 5 acres. This provides resource managers with better volume estimates and provides many of our models and simulators better data to model. Permanent Plots: CFI and SBI
CFI SBI Permanent Plots: CFI and SBI
CFI Notes on CFI: Often CFI is applied to a rigid systematic grid, where each plot represents equal proportion of the total forest area. BUT systematic grids are inflexible to changing management priorities. Permanent Plots: CFI and SBI