Download
1 / 85
850 likes | 852 Views
This outline discusses the role of performance knowledge and model-based performance engineering in scalable systems. It introduces the TAU performance system and explores topics such as performance data mining and heterogeneous performance measurement. The aim is to deliver effective performance with high productivity value in parallel systems.

E N D
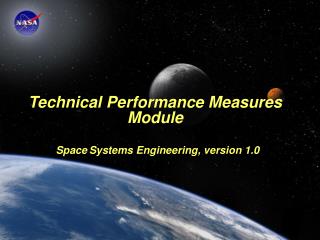
Extreme Performance Engineering:Petascale and Heterogeneous Systems Allen D. Malony Department of Computer and Information Science University of Oregon
Outline Part 1 • Scalable systems and productivity • Role of performance knowledge • Performance engineering claims • Model-based performance engineering and expectations Part 2 • Introduction to the TAU performance system Part 3 • Performance data mining • Heterogeneous performance measurement (TAUcuda) • Parallel performance monitoring (TAUmon)
Parallel Performance Engineering and Productivity • Scalable, optimized applications deliver HPC promise • Optimization through performance engineering process • Understand performance complexity and inefficiencies • Tune application to run optimally at scale • How to make the process more effective and productive? • What performance technology should be used? • Performance technology part of larger environment • Programmability, reusability, portability, robustness • Application development and optimization productivity • Process, performance technology, and use will change as parallel systems evolve and grow to extreme scale • Goal is to deliver effective performance with high productivity value now and in the future
Parallel Performance Engineering Process PerformanceTechnology • Data mining • Models • Expert systems PerformanceTechnology • Experimentmanagement • Performancestorage PerformanceTechnology • Instrumentation • Measurement • Analysis • Visualization • Traditionally an empirically-based approach observation experimentation diagnosis tuning • Performance technology developed for each level PerformanceTuning hypotheses Performance Diagnosis properties Performance Experimentation characterization Performance Observation
Performance Technology and Scale • What does it mean for performance technology to scale? • Instrumentation, measurement, analysis, tuning • Scaling complicates observation and analysis • Performance data size and value • standard approaches deliver a lot of data with little value • Measurement overhead, intrusion, perturbation, noise • measurement overhead intrusion perturbation • tradeoff with analysis accuracy • “noise” in the system distorts performance • Analysis complexity increases • More events, larger data, more parallelism • Traditional empirical process breaks down at extremes
Performance Engineering Process and Scale • What will enhance productive application development? • Address application (developer) requirements at scale • Support application-specific performance views • What are the important events and performance metrics • Tied to application structure and computational model • Tied to application domain and algorithms • Process and tools must be more application-aware • Support online, dynamic performance analysis • Complement static, offline assessment and adjustment • Introspection of execution (performance) dynamics • Requires scalable performance monitoring • Integration with runtime infrastructure
Whole Performance Evaluation • Extreme scale performance is an optimized orchestration • Application, processor, memory, network, I/O • Reductionist approaches to performance will be unable to support optimization and productivity objectives • Application-level only performance view is myopic • Interplay of hardware, software, and system components • Ultimately determines how performance is delivered • Performance should be evaluated in toto • Application and system components • Understand effects of performance interactions • Identify opportunities for optimization across levels • Need whole performance evaluation practice
Role of Intelligence, Automation, and Knowledge • Scale forces the process to become more intelligent • Even with intelligent and application-specific tools, the decisions of what to analyze is difficult • More automation and knowledge-based decision making • Build these capabilities into performance tools • Support broader experimentation methods and refinement • Access and correlate data from several sources • Automate performance data analysis / mining / learning • Include predictive features and experiment refinement • Knowledge-driven adaptation and optimization guidance • Address scale issues through increased expertise
Role of Structure in Performance Understanding • Dealing with increasedcomplexity of the problem(measurement and analysis)should not be the only focus • There is fundamental structurein the computational modeland an application's behavior • Performance is a consequenceof structural forms and behaviors • It is the relationship between performance data and application semantics that is important to understand • This need not be complex (not as complex as it seems) Shigeo Fukuda, 1987Lunch with a Helmut On
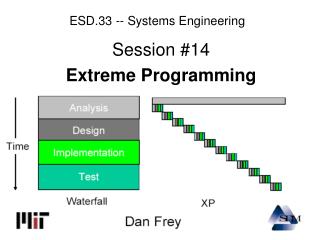
Extreme Performance Engineering Claims Claim 1: “Scaling up” current performance measurement and analysis techniques are insufficient for extreme scale (ES) performance diagnosis and tuning. Claim 2: Performance of ES applications and systems should be evaluated in toto, to understand the effects of performance interactions and identify opportunities for optimization based on whole-performance engineering. Claim 3: Adaptive ES applications might require performance monitoring, dynamic control, and tight coupling between the application and system at run time. Claim 4: Optimization of ES applications requires model-level knowledge of parallel algorithms, parallel computation, system, and performance.
Models-based Performance Engineering • Performance engineering tools and practice must incorporate a performance knowledge discovery process • Focus on and automate performance problem identification and use to guide tuning decisions • Model-oriented knowledge • Computational semantics of the application • Symbolic models for algorithms • Performance models for system architectures / components • Use to define performance expectations • Higher-level abstraction for performance investigation • Application developers can be more directly involved in the performance engineering process
Performance Expectations • Context for understanding the performance behavior of the application and system • Traditional performance implicitly requires an expectation • Users are forced to reason from the perspective of absolute performance for every performance experiment and every application operation • Peak measures provide an absolute upper bound • Empirical data alone does not lead to performance understanding and is insufficient for optimization • Empirical measurements lack a context for determining whether the operations under consideration are performing well or performing poorly
Sources of Performance Expectations Computation Model – Operational semantics of a parallel application specified by its algorithms and structure define a space of relevant performance behavior Symbolic Performance Model – Symbolic or analytical model provides the relevant parameters for the performance model, which generate expectations Historical Performance Data – Provides real execution history and empirical data on similar platforms Relative Performance Data – Used to compare similar application operations across architectural components Architectural parameters – Based on what is known of processor, memory, and communications performance
Model Use • Performance models derived from application knowledge, performance experiments, and symbolic analysis • They will be used to predict the performance of individual system components, such as communication and computation, as well as the application as a whole. • The models can then be compared to empirical measurements—manually or automatically—to pin point or dynamically rectify performance problems. • Further, these models can be evaluated at runtime in order to reduce perturbation and data management burdens, and to dynamically reconfigure system software.
Where are we now? • Large-scale performance measurement and analysis • TAU performance system • HPCToolkit • Running on LCF machines • SciDAC PERI • Automatic performance tuning • Application / architecture modeling • Tiger teams • Performance database • PERI DB project • TAU PerfDMF
Where are we now? (2) • Performance data mining • TAU PerfExplorer • multi-experiment data mining • analysis scripting, inference • SciDAC TASCS • Computational Qualityof Service (CQoS) • Configuration, adaptation • DOE FastOS (with Argonne) • Linux (ZeptoOS) performancemeasurement (KTAU) • Scalable performance monitoring
Where are we now? (3) • Language integration • OpenMP • UPC • Charm++ • SciDAC FACETS • Load balance modeling Projections TAU • Automated performance testing
What do we need? • Performance knowledge engineering • At all levels • Support the building of models • Represented in form the tools can reason about • Understanding of “performance” interactions • Between integrated components • Control and data interactions • Properties of concurrency and dependencies • With respect to scientific problem formulation • Translate to performance requirements • More robust tools that are being used more broadly
TAU Performance System Components Performance Monitoring Performance Data Mining TAU Architecture Program Analysis PDT PerfExplorer Parallel Profile Analysis PerfDMF ParaProf TAUoverSupermon
Performance Data Management • Provide an open, flexible framework to support common data management tasks • Foster multi-experiment performance evaluation • Extensible toolkit to promote integration and reuse across available performance tools (PerfDMF) • Originally designed to address critical TAU requirements • Can import multiple profile formats • Supports multiple DBMS: PostgreSQL, MySQL, ... • Profile query and analysis API • Reference implementation for PERI-DB project
Metadata Collection • Integration of XML metadata for each parallel profile • Three ways to incorporate metadata • Measured hardware/system information (TAU, PERI-DB) • CPU speed, memory in GB, MPI node IDs, … • Application instrumentation (application-specific) • TAU_METADATA() used to insert any name/value pair • Application parameters, input data, domain decomposition • PerfDMF data management tools can incorporate an XML file of additional metadata • Compiler flags, submission scripts, input files, … • Metadata can be imported from / exported to PERI-DB
Performance Data Mining / Analytics • Conduct systematic and scalable analysis process • Multi-experiment performance analysis • Support automation, collaboration, and reuse • Performance knowledge discovery framework • Data mining analysis applied to parallel performance data • comparative, clustering, correlation, dimension reduction, … • Use the existing TAU infrastructure • PerfExplorer v1 performance data mining framework • Multiple experiments and parametric studies • Integrate available statistics and data mining packages • Weka, R, Matlab / Octave • Apply data mining operations in interactive enviroment
How to explain performance? • Should not just redescribe the performance results • Should explain performance phenomena • What are the causes for performance observed? • What are the factors and how do they interrelate? • Performance analytics, forensics, and decision support • Need to add knowledge to do more intelligent things • Automated analysis needs good informed feedback • iterative tuning, performance regression testing • Performance model generation requires interpretation • We need better methods and tools for • Integrating meta-information • Knowledge-based performance problem solving
PerfExplorer 2.0 • Performance data mining framework • Parallel profile performance data and metadata • Programmable, extensible workflow automation • Rule-based inference for expert system analysis
S3D Scalability Study • S3D flow solver for simulation of turbulent combustion • Targeted application by DOE SciDAC PERI tiger team • Performance scaling study (C2H4 benchmark) • Cray XT3+XT4 hybrid, XT4 (ORNL, Jaguar) • IBM BG/P (ANL, Intrepid) • Weak scaling (1 to 12000 cores) • Evaluate scaling of code regions and MPI • Demonstration of scalable performance measurement, analysis, and visualization • Understanding scalability • Requires environment for performance investigation • Performance factors relative to main events
S3D Computational Structure • Domain decompositionwith wavefront evaluationand recursion dependencesin all 3 grid directions • Communication affectedby cell location 12 13 14 15 4x4 example: 8 9 10 11 2 neighbors 4 5 6 7 3 neighbors 0 1 2 3 4 neighbors Center cells Corner cells Data: Sweep3D on Linux Cluster, 16 processes
S3D on a Hybrid System (Cray XT3 + XT4) • 6400 core execution on transitional Jaguar configuration MPI_Wait ORNL Jaguar* Cray XT3/XT4* 6400 cores
Zoom View of Parallel Profile (S3D, XT3+XT4) • Gap represents XT3 nodes • MPI_Wait takes less time, other routines take more time
Scatterplot (S3D, XT3+XT4) • Scatterplot oftop threeroutines • Processmetadata isused to colorperformanceto machinetype (2 clusters) • Memory speedaccounts forperformancedifference!!! 6400 cores
S3D Run on XT4 Only Better balance across nodes More uniform performance
Capturing Analysis and Inference Knowledge • Create PerfExplorer workflow for S3D case study? Load Data Extract Non-callpath data Extract top 5 events Load metadata Correlate events With metadata Process inference rules
PerfExplorer Workflow Applied to S3D Performance --------------- JPython test script start ------------ doing single trial analysis for sweep3d on jaguar Loading Rules... Reading rules: rules/GeneralRules.drl... done. Reading rules: rules/ApplicationRules.drl... done. Reading rules: rules/MachineRules.drl... done. loading the data... Getting top 10 events (sorted by exclusive time)... Firing rules... MPI_Recv(): "CALLS" metric is correlated with the metadata field "total neighbors". The correlation is 1.0 (direct). MPI_Send(): "CALLS"metric is correlated with the metadata field "total Neighbors". The correlation is 1.0 (direct). MPI_Send(): "P_WALL_CLOCK_TIME:EXCLUSIVE" metric is correlated with the metadata field "total neighbors". The correlation is 0.8596 (moderate). SOURCE [{source.f} {2,18}]: "PAPI_FP_INS:EXCLUSIVE" metric is inversely correlated with the metadata field "Memory Speed (MB/s)". The correlation is -0.9792 (very high). SOURCE [{source.f} {2,18}]: "PAPI_FP_INS:EXCLUSIVE" metric is inversely correlated with the metadata field "Seastar Speed (MB/s)". The correlation is -0.9785258663321764 (very high). SOURCE [{source.f} {2,18}]: "PAPI_L1_TCA:EXCLUSIVE" metric is inversely correlated with the metadata field "Memory Speed (MB/s)”. The correlation is -0.9818810020169854 (very high). SOURCE [{source.f} {2,18}]: "PAPI_L1_TCA:EXCLUSIVE" metric is inversely correlated with the metadata field "Seastar Speed (MB/s)”. The correlation is -0.9810373923601381 (very high). SOURCE [{source.f} {2,18}]: "PAPI_L2_TCM:EXCLUSIVE" metric is inversely correlated with the metadata field "Memory Speed (MB/s)”. The correlation is 0.9985297567878844 (very high). SOURCE [{source.f} {2,18}]: "PAPI_L2_TCM:EXCLUSIVE" metric is inversely correlated with the metadata field "Seastar Speed (MB/s)”. The correlation is 0.996415213842904 (very high). SOURCE [{source.f} {2,18}]: "P_WALL_CLOCK_TIME:EXCLUSIVE" metric is inversely correlated with the metadata field "Memory Speed (MB/s)”. The correlation is -0.9980107779462387 (very high). SOURCE [{source.f} {2,18}]: "P_WALL_CLOCK_TIME:EXCLUSIVE" metric is inversely correlated with the metadata field "Seastar Speed (MB/s)”. The correlation is -0.9959749668655212 (very high). ...done with rules. ---------------- JPython test script end ------------- Correlated communication behavior with metadata Identified hardware differences Cray-specific inference
S3D Weak Scaling (Cray XT4, Jaguar) C2H4 benchmark
S3D Weak Scaling (IBM BG/P, Intrepid) C2H4 benchmark Jaguar Intrepid
S3D Event Correlation to Total Time (Jaguar) r = 1 implies direct correlation
S3D 3D Correlation Cube (Intrepid, MPI_Wait) GETRATES_I vs. RATI_I vs. RATX_I vs. MPI_Wait
Heterogeneous Parallel Systems and Performance • Heterogeneous parallel systems are highly relevant today • Heterogeneous hardware technology more accessible • Multicore processors (e.g., 4-core, 6-core, 8-core, 16-core) • Manycore (throughput) accelerators (e.g., Tesla, Fermi) • High-performance engines (e.g., Intel) • Special purpose components (e.g., FPGAs) • Performance is the main driving concern • Heterogeneity is an important (the?) path to extreme scale • Heterogeneous software technology to get performance • More sophisticated parallel programming environments • Integrated parallel performance tools • support heterogeneous performance model and perspectives
Implications for Parallel Performance Tools • Current status quo is somewhat comfortable • Mostly homogeneous parallel systems and software • Shared-memory multithreading – OpenMP • Distributed-memory message passing – MPI • Parallel computational models are relatively stable (simple) • Corresponding performance models are relatively tractable • Parallel performance tools can keep up and evolve • Heterogeneity creates richer computational potential • Results in greater performance diversity and complexity • Heterogeneous systems will utilize more sophisticated programming and runtime environments • Performance tools have to support richer computation models and more versatile performance perspectives
Heterogeneous Performance Views • Want to create performance views that capture heterogeneous concurrency and execution behavior • Reflect interactions between heterogeneous components • Capture performance semantics relative to computation model • Assimilate performance for all execution paths for shared view • Existing parallel performance tools are CPU (host)-centric • Event-based sampling (not appropriate for accelerators) • Direct measurement (through instrumentation of events) • What perspective does the host have of other components? • Determines the semantics of the measurement data • Determines assumptions about behavior and interactions • Performance views may have to work with reduced data
Task-based Performance View • Consider the “task” abstraction for GPU accelerator scenario • Host regards external execution as a task • Tasks operate concurrently withrespect to the host • Requires support for trackingasynchronous execution • Host creates measurementperspective for external task • Maintains local and remote performance data • Tasks may have limited measurement support • May depend on host for performance data I/O • Performance data might be received from external task • How to create a view of heterogeneous external performance?
TAUcuda Performance Measurement (Version 2) • Performance measurement of heterogeneous applications using CUDA • CUDA system architecture • Implemented by CUDA libraries • driver and device (cuXXX) libraries • runtime (cudaYYY) library • Tools support (Parallel Nsight (Nexus), CUDA Profiler) • not intended to integrate with other HPC performance tools • TAUcuda (v2) built on experimental Linux CUDA driver • Linux CUDA driver R190.86 supports a callback interface!!! • Currently working with NVIDIA to develop version with production performance tools API