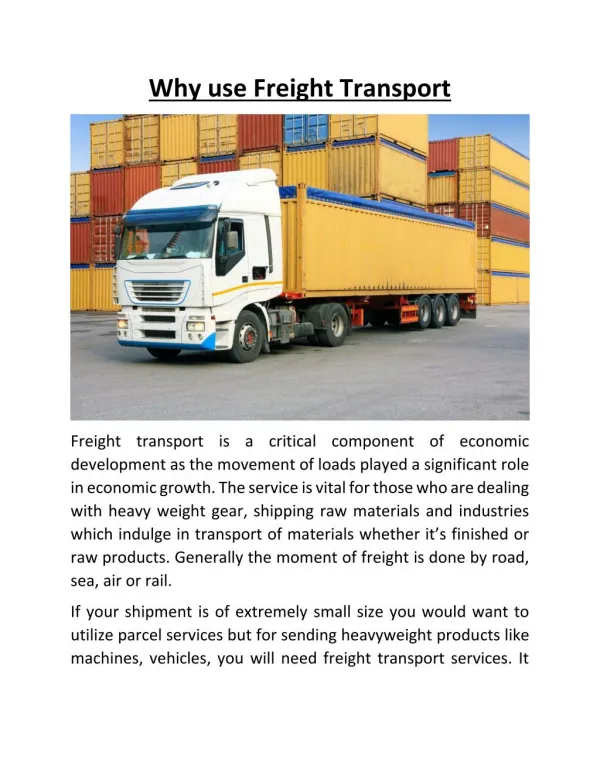
Download
1 / 21
210 likes | 308 Views
ECIV 790U INTERMODAL FREIGHT TRANSPORT Project Presentation. Estimation of Modal Diversion and Economic Benefits due to Rail Service Improvements in South Carolina by Omor Sharif. Introduction. Transportation policy/infrastructure changes in South Carolina

E N D
ECIV 790U INTERMODAL FREIGHT TRANSPORT Project Presentation Estimation of Modal Diversion and Economic Benefits due to Rail Service Improvements in South Carolina by Omor Sharif
Introduction • Transportation policy/infrastructure changes in South Carolina • How much ‘Modal Diversion’ will occur? • How much ‘Economic Benefits’ of the changes? • The ITIC Model -Intermodal Transportation and Inventory Cost Model
The ITIC Model • A spreadsheet based computer model • Version 1.0 of the model was published in 2005 by US Department of Transportation and Federal Railroad Administration • Highway to Rail Intermodal Version • Follows a logistics managers perspective who choose a mode and shipment size • Transportation alternatives is chosen based on minimum total logistics costs
Objective • Estimate the diversion of highway freight traffic to rail intermodal service • Estimate the economic benefits of changes • Understand the underlying methodology • Application of TRANSEARCH Data
Contribution • Selecting suitable data sources for the model • Development of Inputs for the model such as Freight Rates, Rail Miles, Dray Miles, Junction Frequency • Understanding the modal diversion impact of rail service improvement
Prior Research • The model itself refers to many sources regarding previous research • Case studies: using the model by various organizations at federal/state/local governments
Methodology- Data 1. Serial Number 2. Commodity Description 3. Commodity Code—Standard Transportation Commodity Code* 4. Pounds per Year* 5. Pounds per Shipment* 6. Value of Commodity—Dollars per pound* 7. Origination State 8. Destination State 9. Origin FIPS 10. Destination FIPS 11. Observed Mode (Truck)* 12. Truck rate per mile for 3S2* 13. Truck highway miles* 14. Truckload per shipment* 15. Number of Trailer on Flat Car (TOFC)/Number of Container on Flat Car (COFC) (0)* 16. Rail Junction Frequency (0)* 17. Observed Rail revenue per hundred weight (cwt) (1)* 18. Rail variable cost per cwt* 19. Rail miles* 20. TOFC pickup miles* 21. TOFC delivery miles*
Transportation Cost Formulas in TSW worksheet: • Lb/day = (lb/year) / 365 • Days between orders = final lbs in the shipment / (lb/day) • Transit time (Rail) = Rail Miles / Rail Speed + Dray Miles / Dray Speed + Dwell time at origin and destination terminals (0.5 days at each) + Interchange delays (1.5 days – if there is an interchange) [Both rail and dray speed is based on 24 hours] • Transit time (Truck) = Truck Miles / Truck Speed [truck speed is based on 10 hours a day] • Expected L&D claim per shipment = L&D as percent of gross freight revenue X transport charges per shipment • Transport charges per shipment (Rail) = (Load/unload hours X Hourly wage) + final lb in shipment X rail rev per cwt / 100 • Transport charges per shipment (Truck) = Handling cost per shipment + Linehaul cost per shipment = (Load/unload hours X Hourly wage) + (Linehaul miles X Linehaul cost per mile + Linehaul miles X Additional fee per mile + One time additional fee) • Number of shipments/yr = final lbs in shipment X lb/year • transport charges/yr = transport charges per ship X Number of shipments/yr
Non Transportation Logistics Cost Formulas in TSW worksheet: • Order cost = (Order cost per shipment + Dunnage) X Number of shipments/yr [for ‘truck’ dunnage is 0] • In-transit stock carrying cost = Lb/day X Dollars/lb X Transit time X Interest • cycle stock carrying cost = Dollars/lb X inventory carrying cost factor X final lbs in shipment / 2 • Loss & damage claims = Expected L&D claim per shipment X Number of shipments/yr • Capital cost on claims = claim payment days X loss & damage claims X Interest • Safety stock carrying cost = safety stock (lb) X Dollars/lb X inventory carrying cost factor • Total Non-Transportation Logistics Costs = Order cost + In-transit stock carrying cost + cycle stock carrying cost + Loss & damage claims + Capital cost on claims + safety stock carrying cost
A sample analysis • Transearch 2008 as Preliminary Data Source • Origin- South Carolina • Destination- Florida and Virginia • Total Records- 27000+ • STCC Commodity codes are kept at 4 digit level
An Analysis of the Operational Costs of Trucking:2012 Update By ATRI (http://www.glostone.com/wp-content/uploads/2012/09/ATRI-Operational-Costs-of-Trucking-2012.pdf)
Forecast of 2023 Freight Rate • Inadequate Historical data • Longer forecast horizonmakes forecasting difficult • Extrapolation techniques have higher success in short time horizon • Regression, Time Series Analysis?? • A value of $2.10 was assumed in the sample analysis for now!
Rail Miles • SC 2008 Transearch does not provide county outside SC, only BEA • Possible Alternative: County-to-County Distance Matrix at CTA http://cta.ornl.gov/transnet/SkimTree.htm and use regression Matrix of distances and network impedances between each pair of county centroids via highway, railroad, water, and combined highway-railpaths Regression between Intermodal Rail and Highway Miles based on 125 samples
Dray Miles • For combined highway-rail CTA provides Highway and Rail miles here for each pair of county http://cta.ornl.gov/transnet/SkimTree.htm • Take Dray miles as a percentage of Rail Miles and use data fitting • Best Fit Distribution is ‘Gamma’ out of seven tested using ‘fitdistrplus’ package in R (Anderson-Darling statistic: 0.3201 ) based on 125 samples Fitting of the distribution ' gamma ' by maximum likelihood Parameters : estimate Std. Error shape 1.3586393 0.15588283 rate 0.1922481 0.02656798 • Use GAMMA.INV(RAND(),1.359,1/0.192) * Rail Miles / 100 in EXCEL.
Preparing Input File for analysis (truck iticinput.xls) • Discard Transearch records when ‘shipment weight’ is zero • Discard Transearchrecords when ‘truck miles’ is zero • Format ‘STCC’ codes as ‘Text’ in Excel, not as ‘Numbers’ • Add zero before one digit STCC code (01, 08, 09 instead of 1, 8, 9) • Put ‘unknown’ in ‘rail VC per cwt’ column and ‘1’ in ‘obsrail rev per cwt’ • Junction Frequency = 1 if Truck Miles > 1000, otherwise 0.
A sample analysis By Year 2023Rail is offering the following service improvements- • Increase rail speed by 8 mph (30 mph to 38 mph, Truck = 50 mph) • Improve reliability from 0.45 to 0.42 (Truck = 0.40) • Reduce Loss & Damage Claims 20% to 10% (Truck = 7%)
Results About 17000 records were selected for policy analysis after base case run of about 22000 records. Not many Mis-assigned, mostly excluded because they failed cost < revenue criteria.
Exclude when ‘Variable Cost > Revenue’ $ / 100 lb comparison Not considered if ‘Variable Cost > Revenue’ • Rail Revenue = 0.95 X Cost per mile of 3S2 X 3S2 Miles X 100 / Shipment weight in lb • Rail Variable Cost = Dray Pickup charge / Shipment weight in lbX 100 + ((Variable Cost per mile X Rail Miles + Total Lift charges at Origin and Destination) / Shipment weight in lb X 100) / 0.909 • So, short transport distances have higher chances of being excluded.