Download
1 / 114
1.14k likes | 1.4k Views
UCSC Cancer Browser Workshop. Mary Goldman mary@soe.ucsc.edu. First: use Firefox or Chrome. Please do not use Internet Explorer Download Firefox or Chrome if you need to Our browser does have some functionality on IE but it is limited. Use Firefox or Chrome for our full feature set.

E N D
UCSC Cancer Browser Workshop Mary Goldman mary@soe.ucsc.edu
First: use Firefox or Chrome Please do not use Internet Explorer • Download Firefox or Chrome if you need to Our browser does have some functionality on IE but it is limited. Use Firefox or Chrome for our full feature set.
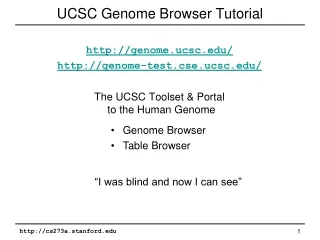
What is the Cancer Browser? It is a tool to visually explore and analyze cancer genomics data and its associated clinical information. https://genome-cancer.ucsc.edu/
It can be used to: • analyze data on the browser • do proof-of-concept visualization to determine if more complicated analysis is worth performing • visualize analysis results • for colleagues, papers, presentations, posters, etc.
Outline • Quick overview of the browser • Overview of our data (TCGA + more) • How to use the browser • Breast cancer PAM50 example • Lower Grade Glioma Telomere example
Outline • Quick overview of the browser • Overview of our data (TCGA + more) • How to use the browser • Breast cancer PAM50 example • Lower Grade Glioma Telomere example
Genomic data Clinical data
Samples Genomic locations / Genes Genomic data Clinical data
Samples Genomic locations / Genes Genomic data Clinical data
Both clinical and genomic heatmaps sorted by left-most clinical feature and then subsorted on following features
Red = amplification Blue = deletion
Also known as stacked bar graphs, proportions view shows the distribution of each column of data
Outline • Quick overview of the browser • Overview of our data (TCGA + more) • How to use the browser • Breast cancer PAM50 example • Lower Grade Glioma Telomere example
Data Sources • TCGA • TARGET and other pediatric cancer • CCLE • SU2C • Connectivity Map • 698 datasets including 526 public datasets • 227,000 samples
Level 3 data All of the TCGA data we display are Level 3. Level 3 means: • read-level data has been summarized to gene- and probe-level data • no longer patient identifiable • publicly available
TCGA Data types • Copy Number Variation • DNA Methylation • Gene and exon expression • Somatic mutation (gene-level) • Protein expression • Paradigm Pathway activity
TCGA Data types • Copy Number Variation • DNA Methylation • Gene and exon expression • Somatic mutation • Protein expression • Paradigm Pathway activity Vaske,C.J., Benz,S.C., Sanborn,J.Z., Earl,D., Szeto,C., Zhu,J., Haussler,D. and Stuart,J.M. (2010) Inference of patient-specific pathway activities from multi-dimensional cancer genomics data using PARADIGM. Bioinformatics, 26, i237-i245.
Multidimensional data is challenging Gene Expression DNA Methylation Copy Number Variation Mutation
Paradigm • Infers patient-specific pathway activities using CNV and gene expression data • Developed at UCSC • Multiple datasets depending on what data was used to make the calls (e.g. RNAseq + CNV) Vaske, et. al. 2010
PANCAN12 Datasets • TCGA formed an Analysis Working Group to look at genomics abnormalities across cancers • 12 tumor types: breast cancer, ovarian cancer, GBM, .... • CNV, expression, mutation, protein Hoadley,K.A., Yau,C., Wolf,D.M., Cherniack,A.D., Tamborero,D., Ng,S., Leiserson,M.D.M., Niu,B., McLellan,M.D., Uzunangelov,V., et. al. (2014) Multiplatform Analysis of 12 Cancer Types Reveals Molecular Classification within and across Tissues of Origin. Cell, 158, 929–944.
Pan-Cancer datasets • We assembled these datasets • 19 tumor types: breast cancer, ovarian cancer, GBM, melanoma, thyroid cancer, .... • CNV, expression, mutation, paradigm
Pan-Cancer mutations Looking at the most frequently mutated genes in cancer, we can see across almost 4.5K samples that TP53 is by far the most mutated
Pan-Cancer Normalized Gene expression • Allows you to see differences in expression across all cancer types • Combine illumina RNAseq data from all TCGA cohorts • Mean-normalized per gene
GBM FOXM1 Pathway LGG FOXM1 Pathway https://genome-cancer.ucsc.edu/proj/site/hgHeatmap/#?bookmark=c347fdabddde3e73d824caff1290a6a8
TCGA Data Curation • Map between patient, sample and omic IDs. Same ID on genomic and clinical matrices • Curated overall and recurrence-free survival • More easily readable clinical/phenotype data • Matrix format can be downloaded for both genomic and phenotype/clinical data
Non-TCGA Public Data • TARGET and Childhood cancer • Cell line data (CCLE, SU2C, Connectivity Map)
TARGET and Childhood cancer • TARGET applies a comprehensive genomic approach to determine molecular changes that drive childhood cancers. (AML and Neuroblastoma) • Other cancer types, including some from the Pediatric Tumor Affymetrix Database
Cell Line data • CCLE: Genome-wide information of ~1000 cell lines under baseline condition. Pharmacologic response profiles (IC50) and mutation status analysis. • SU2C: 50 Breast cancer cell lines. GI50 to 77 therapeutic compounds. • Connectivity Map: 4 cell lines and 1309 perturbagens at several concentrations. Gene expression change after treatment.
Outline • Quick overview of the browser • Overview of our data (TCGA + more) • How to use the browser • Breast cancer PAM50 example • Lower Grade Glioma Telomere example
Outline • Quick overview of the browser • Overview of our data (TCGA + more) • How to use the browser • Breast cancer PAM50 example • Lower Grade Glioma Telomere example
PAM50 • Breast cancer • 4 major intrinsic subtypes: Luminal A, Luminal B, Her2-enriched, Basal • Subtypes are clinically relevant for drug sensitivity and long-term survival • Determine tumor subtype by looking at the gene expression of 50 genes
Our Goals • Look at the expression of these 50 genes and their relationship to the subtype calls • Look at the survivorship of these different subtypes • Make a bookmark to share with others
Steps • Go to https://genome-cancer.ucsc.edu/ • Open TCGA Breast Agilent dataset • Go to genes mode • Replace current geneset with the predefined PAM50 geneset from the Favorites menu. • Perform KM plot • Bookmark the view to share
How to view Kaplan-Meier Plots better survival Steep curve = Poor survival Survival worse survival Time
Initially Luminal AB have higher survival than Basal / HER2-enriched
As patients age, Basal / HER2-enriched have higher survival than Luminal AB
Bonus Question We know that several of these tumor samples went through both Agilent and RNAseq analysis. Now we now want to see if the gene expression patterns we're seeing for these 50 genes are Agilent specific or if they are cross-platform. • How do you do this?
More information: PAM50 • Tumors can instead be classified by hormone cell surface receptors --> ER, PR and HER2 • Patients who have at least one of these cell surface receptors tend to respond to traditional hormone therapy • Patients who are triple negative (negative for all 3 cell surface receptors) typically do not respond and have a poor prognosis
Our Goals • Examine relationship between these two subtyping methods • Examine survivorship of triple negative patients compared with other patients
But! There is no 'triple negative' classification in the browser. • We will need to create this classification and load it back into the browser
Steps • Download clinical data in view • Open clinical data Excel or other spreadsheet program
Our Goal for Excel Create a column next to the Sample ID column, where if the sample is triple negative it will be "1". Otherwise it will be "0". • https://genome-cancer.ucsc.edu/download/public/BRCA_modified_clinical.xls