Download
1 / 30
300 likes | 454 Views
Getting rid of Rayleigh. Åsmund Rinnan. Introduction Fluorescence. Emitted from sample. Excites sample. Sample. Light source. Detector. Introduction Fluorescence. Introduction PARAFAC. Can be seen as an expansion of PCA from two-way data to multi-way data. X is the EEM

E N D
Getting rid of Rayleigh Åsmund Rinnan
IntroductionFluorescence Emitted from sample Excites sample Sample Light source Detector
IntroductionPARAFAC Can be seen as an expansion of PCA from two-way data to multi-way data X is the EEM a are the scores b are the emissionspectra c are the excitationspectra E is the residuals
IntroductionPARAFAC & Fluorescence Catechol Hydroquinone
IntroductionLight scatter – The trouble maker 1st order Rayleigh Raman 2nd orderRayleigh Excitation Emission
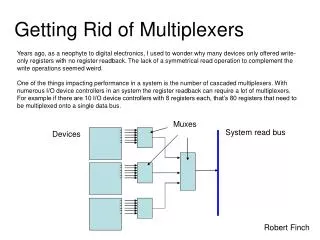
Getting rid of Rayleigh • Cut off and insert missing/ zeros • Subtraction of standard • Weights • Modeling of Rayleigh
Missing values Signal/ Data area Missing values Zeros Thygesen, Rinnan, Barsberg & Møller
Example • 18 wood samples • 4 different levels of p-benzoquinone adsorbed in the fiber cell walls • 30 emission wavelengths x 35 excitation wavelengths Thygesen, Rinnan, Barsberg & Møller
WOW! None Weighted Zeros Non-Negativity
So, now Rayleigh is finished, right? • The data presented so far is a bit simple Sugar data 1st order Rayleigh Emission Excitation
Weighting - MILES Emission loadings Excitation loadings
Using a band of missing valuesHard weights Emission loadings Excitation loadings
Using a band of missing valuesMILES weights Emission loadings Excitation loadings
Another method?Why, why, why? • The Rayleigh scatter width has to be estimated quite accurately • The band width of missing data should also be correct • What about an automatic method of removing the Rayleigh scatter, that was not so prone to the estimation of the width of the Rayleigh scatter? • Modeling the Rayleigh is the answer!
Modeling Rayleigh • A Gauss-Lorentz curve fitting method
Modeling Rayleigh Rinnan, Booksh & Bro
With constraints even better Emission loadings Excitation loadings Rinnan, Booksh & Bro
Thanks to: Rasmus Bro, Karl Booksh, Lisbeth G Thygesen, Søren Barsberg, Jens K S Møller and Charlotte Andersen • Thank you for your attention