Download
1 / 31
310 likes | 314 Views
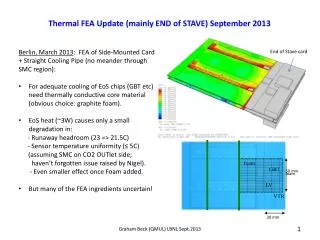
Thermal Tests of Outer Pixel Stave Prototype Mark Convery(SLAC), Marco Oriunno (SLAC), Murdoc k Gilchries(LBNL), Bill Miller(ITI). Cable ( 0.5mm thick) buried in foam Detailed layout of prototype cable underway. Outer Pixel Stave Design. Two options for cable connection to modules

E N D
Thermal Tests of Outer Pixel Stave Prototype Mark Convery(SLAC), Marco Oriunno (SLAC), Murdock Gilchries(LBNL), Bill Miller(ITI) Thermal Tests of Outer Staves
Cable (0.5mm thick) buried in foam Detailed layout of prototype cable underway Outer Pixel Stave Design • Two options for cable connection to modules • Cable on top/bottom of stave • Cable buried in stave. • Buried cable preferred due to better thermal performance • Current prototype is “unburied” design Thermal Tests of Outer Staves
Outer Stave Prototype • Built by Allcomp, Inc and LBNL • Platinum on silicon heaters used to simulate thermal load Thermal Tests of Outer Staves
Water Cooling Tests at LBNL • Room termperature H20 at 1 l/min • Temperature measured using IR imaging • Heat load corresponds to nominal LHC conditions Thermal Tests of Outer Staves
SLAC CO2 Blown System Thermal Tests of Outer Staves
A B 21oC,58 bar -10oC,58 bar Pre-cooling E F D C -37oC,11 bar 80W G Thermal Tests of Outer Staves
Evaporation Temperature Pressure Transmitter Drucker 7500 Tee Swagelok ¼” Pt100 Temp sensor Thermal Tests of Outer Staves
Stave Gas Connections • High pressure fittings needed for running with CO2 • Insulated “cold box” used to minimize convection and heat loss SSteel Tube brazed on modified Swagelok fitting ID tube 2.2 mm, wall thickness 300um Thermal Tests of Outer Staves
Stave Electrical Connections • PT100 RTD’s glued to platinum-on-silicon heaters • Heaters connected in serial. Two circuits on top, two circuits on bottom • For initial data, only power top heaters 1200 mm Thermal Tests of Outer Staves
Labview Controls • National Instruments CompactDAQ system • 20 channels of RTD readout • 32 multi-purpose (pressure, flow, etc.) Thermal Tests of Outer Staves
Typical Run Run with the blow system Temp.profile @80W Induced dry out Temp.profile @100W oC dry out mf =2.65g/s 100 W mf =1.7g/s 80 W No power mf =1.16g/s mf =0.2g/s mf =0.64g/s mf =1.4g/s Thermal Tests of Outer Staves Time
DT Measurements Mass flow 1.4 g/s • Measurements taken at 80 (nominal power) and 100 Watts • Measure DT for each of 12 heaters Average DT=13oC Tfluid Mass flow 1.16 g/s Average DT=11oC Tfluid Tevap Thermal Tests of Outer Staves
CO2/H20 Comparisons • Ts-Tfluid = (Ts-Tw) + (Tw-Tfluid) • (Tw-Tfluid)=Q/hA • h taken from Forced Convection Correlations • For H20, h = 16347 W/m2K • For CO2 at 80 W, h = 6800 W/m2K (DTfluid = 1.9 C) • For CO2 at 100 W, h = 7400 W/m2K (DTfluid=1.5C) • Define Thermal Impedance, R = (Tsurface-Twall)/Q • Good agreement between H2O and CO2. • Confirms that R is independent of • Fluid • Temperature • Power CO2@80W CO2@100W H20 with IR imaging Thermal Tests of Outer Staves Ts-Tfluid = (Ts-Tw) + (Tw-Tfluid) (Tw-Tfluid)=Q/hA, for H20 h~16347 W/m2.K (Forced Convection correlations) Thermal impedance R = (Tsurface-Twall)/Q
Dry Out Studies Decreasing the mass flow we forced a dry out with a temperature runaway at the end of the stave 0.2 g/s 0.4 g/s 0.6 g/s Thermal Tests of Outer Staves
Pre-cooling loss 18oC,54 bar 80W -37oC,11 barc Thermal Tests of Outer Staves
Updated Measurements • Have recently improved measurements to include • Heating both sides simultaneously • Measuring T on both sides • Measuring evaporation temperature directly • Analysis and improvements still underway – data preliminary Thermal Tests of Outer Staves
Two Sides Measurements Top T4 T6 T0 T2 T9 T8 T10 B7 B5 B10 B3 B0 Bottom Six separate Heat Loads applied : 80 watts top 80 watts bottom 80 watts top + bottom (nominal load) 100 watts top 100 watts bottom 100 watts top + bottom (1.25 x nominal) Thermal Tests of Outer Staves
Two Sides Measurements Only top face Only top and only bottom on the same graph Temp. on the tube inside the box Temp. inside the tube, out of the box Power on on both face at the same time Thermal Tests of Outer Staves
4 cm Cable, 0.174 Glue, 0.05 Si, 0.5 0.5mm Glue, 0.1 CF, 0.25 Glue, 0.075 Foam, 4.8 SSteel Tube ID2.2, th.0.3 Glue,0.1 Finite Element Model (M. Oriunno) 1 m Thermal Tests of Outer Staves
Materials and geometry HTC water from Dittus-Boelter correlation HTC CO2 from Kandlikar with Ff=1.75 Heat load case studied corresponding to the experimental measurements available: -Water at 20oC, Power 84 W 2-phase Carbon dioxide evap. -37oC, Power 84 W 2-phase Carbon dioxide evap. -35oC, Power 100 W Thermal Tests of Outer Staves
FEA Parameters Materials and geometry HTC water from Dittus-Boelter correlation HTC CO2 from Kandlikar with Ff=1.75 Heat load case studied corresponding to the experimental measurements available: -Water at 20oC, Power 84 W 2-phase Carbon dioxide evap. -37oC, Power 84 W 2-phase Carbon dioxide evap. -35oC, Power 100 W Thermal Tests of Outer Staves
FEA Results Water@RT,84 watt CO2@-37oC,84 watt CO2@-35oC,100 watt Thermal Tests of Outer Staves
Asymmetry due to the staggering in zee The power has been applied only on one face of the stave and, in reason of the staggered geometry, the heat flow path from the sensor to the tube spreads beyond the zee length of the sensors. The temperature drop in the fluid is not constant with a bell-shape distribution. Considering the average value, the effective length to be used used in the calculation is: Leff = Qs/(h.p.D.DTavg) Which gives a value of 75 mm = 1.75 x sensor length Heat Flow Path Temperature distribution Thermal Tests of Outer Staves Temperature profile along the tube (zee) Temperature map along the tube
Summary of the experimental results with water, CO2 and comparison with the FE simulations All the above results are being collect in a Technical Note Thermal Tests of Outer Staves
FEA Study (W. Miller) K13D2U facings 0/90/0 (0.2mm) Cable 0.174mm K5 Allcomp foam Aluminum tube-2.8mm Al close-outs at each end 12 Platinum on Silicon Heaters (0.5mm) (modeled at 0.3mm) K13D2U facings 0/90/0 (0.2mm) Cable 0.174mm K5 Allcomp foam Aluminum tube-2.8mm Al close-outs at each end 12 Platinum on Silicon Heaters (0.5mm) (modeled at 0.3mm) Parameters differ some from Oriunno K13D2U facings 0/90/0 (0.2mm) Cable 0.174mm K5 Allcomp foam Aluminum tube-2.8mm Al close-outs at each end 12 Platinum on Silicon Heaters (0.5mm) (modeled at 0.3mm) Thermal Tests of Outer Staves
CFD Solution: One-sided Heating Fluid temperature rise =1.16ºC LBNL test ΔT=1.1ºC H2O Cooling Fluid temperature rise =1.16ºC LBNL test ΔT=1.1ºC Flow Flow Film coefficient solved by CFD Thermal Tests of Outer Staves
Comparison with LBNL H2O Test Predicted and measured are “average” over heater surface Variation is < 1ºC Additional run time and increased mesh density on CFD might improve curve Thermal Tests of Outer Staves
Stave CO2 Film Coefficient-Predicted Single-sided heating at 84W and low quality—average estimate 7000W/m2K used in FEA. Quality not known.
Stave Solution Assuming CO2 Cooling Plot based on temperature at chip center H=7000W/m2K Tinlet=-37ºC Edge temperature=-26.87ºC Prediction does not include effect of potential ambient heating 83.4W Average Difference=1.1º
Conclusions • First experimental results of a local supports cooled with CO2 • The goal was to have an experimental measure of the thermal impedance for the assembly with pipe-glue-foam and facing. The results are encouraging and look to be in the expectations • Finite Element Analysis are in agreement with measurements • Systematic study of HTC and pressure drops are the next step • The test stand is available to all the colleagues willing to perform CO2 measurements • The test stand is available to all the colleagues willing to perform CO2 measurements • Closed-loop system is planned to be completed near the end of the year. Thermal Tests of Outer Staves
Prototype Considerations • System is currently pressure-relieved at 30 bar. The highest possible pressure is about 75 bar. Any prototype should have fittings capable of supporting this. • The heater power supplies that we use are 0-40 V, 0-5A. It would be easiest if the prototype can be heated with these • IF IR-imaging is desired, the prototype should be painted with IR paint. Thermal Tests of Outer Staves