Download
1 / 46
460 likes | 464 Views
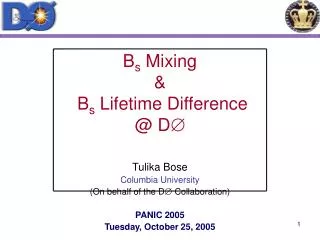
Measurement of B s mixing phase b s at the Tevatron. Gavril Giurgiu Johns Hopkins University on behalf of the CDF and DØ collaboration Physics at LHC, Split, Croatia October 3, 2008. Booster. CDF. DØ. Tevatron. p sou rce. Main Injector & Recycler. Tevatron.

E N D
Measurement of Bs mixing phase bs at the Tevatron Gavril Giurgiu Johns Hopkins University on behalf of the CDF and DØ collaboration Physics at LHC, Split, Croatia October 3, 2008
Booster CDF DØ Tevatron p source Main Injector & Recycler Tevatron - pp collisions at 1.96 TeV - 4 fb–1 data on tape for each experiment - Show analyses with 2.8 fb-1
CDF II Detector DØ Detector • Central tracking: - silicon vertex detector - drift chamber • dpT/pT = 0.0015 pT • → excellent mass resolution • Particle identification: dE/dX and TOF • Good electron and muon ID by calorimeters and muon chambers - Excellent tracking and muon coverage - Excellent calorimetry and electron ID - Silicon layer 0 installed in 2006 improves track parameter resolution tracker
bs Phase and the CKM Matrix - CKM matrix connects mass and weak quark eigenstates - Expand CKM matrix in λ = sin(Cabibbo) ≈ 0.23 ≈ • To conserve probability CKM matrix must be unitary • → Unitary relations can be represented as “unitarity triangles” • unitarity • relations: • unitarity • triangles: ~1 l2 ~ =1 very small CPV phase bs of order l2 accessible in Bs decays
MATTER ANTIMATTER b b s s Bs 0 Bs 0 SM s Neutral Bs System - Time evolution of Bs flavor eigenstates described by Schrodinger equation: • Diagonalize mass (M) and decay (G) matrices • → mass eigenstates : • - Flavor eigenstates differ from mass eigenstates and mass eigenvalues are • different ( Dms = mH - mL≈ 2|M12| ) • → Bs oscillates with frequency Dms • precisely measured by • CDF Dms = 17.77 +/- 0.12 ps-1 • DØDms = 18.56 +/- 0.87 ps-1 • Mass eigenstates have different decay widths • DG = GL – GH≈ 2|G12| cos(Φs) where ≈ 4 x 10⁻³
CP Violation in Bs → J/ΨΦ Decays • Analogously to the neutral B0 system, CP violation in Bs system occurs through • interference of decays with and without mixing: dominant contribution from top quark + • CP violation phase bs in SM is predicted to be very small, O(λ2) • → New Physics CPV can compete or even dominate over small Standard Model CPV • Ideal place to search for New Physics
≈ 4x10⁻³ and SM s bs vs fs - Up to now, introduced two different phases: • New Physics affects both phases by same quantity (arxiv:0705.3802v2): • If the new physics phase dominates over the SM phases and • → neglect SM phases and obtain:
- three decay angles r = (,,) describe directions of final decay products Bs → J/ΨΦ Phenomenology • Extremely physics rich decay mode • Can measure lifetime, decay width • difference DG and CP violating phase bs • - Decay of Bs (spin 0) to J/Ψ(spin 1) Φ(spin 1) leads to three different • angular momentum final states: • L = 0 (s-wave), 2 (d-wave) → CP even ( ≈ short lived or light Bs if Φs ≈ 0 ) • L = 1 (p-wave) → CP odd ( ≈ long lived or heavy Bs if Φs ≈ 0)
| A|| > |Bs0> | A0 > | m+m- K+K- > |B̅s0> | A┴ > |Bs0> Bs → J/ΨΦ Phenomenology (2) - Three angular momentum states form a basis for the final J/ΨΦstate - Use alternative “transversity basis” in which the vector meson polarizations w.r.t. direction of motion are either (Phys. Lett. B 369, 144 (1996), 184 hep-ph/9511363): - transverse (┴ perpendicular to each other) → CP odd - transverse (║ parallel to each other) → CP even - longitudinal (0) → CP even - Corresponding decay amplitudes: A0, A║, A┴
Bs → J/ΨΦ Decay Rate • Bs→ J/ΨΦdecay rate as function of time, decay angles and initial Bs flavor: • time dependence terms angular dependence terms terms with bsdependence terms with Dms dependence present if initial state of B meson (B vs anti-B) is determined (flavor tagged) ‘strong’ phases: - Identification of B flavor at production (flavor tagging) → better sensitivity to bs
Signal Reconstruction • Both CDF and DØ reconstruct B0s→ J/ ψ(→μ+μ-)Φ(→K+K-) in 2.8 fb-1 • CDF ~3200 signal events DØ ~2000 signal events ( expect ~4000 with PID signal selection)
CDF Run II Preliminary 2.8 fb-1 Lifetime and Lifetime Difference • Average Bs lifetime: • (Bs) = 1.53 ± 0.04 (stat) ± 0.01 (syst) ps t(Bs) = 1.52 ± 0.05 (stat) ± 0.01 (syst) ps • Decay width difference DG: • bs = 0: • bs free: • - - -
> 0 < 0 CP Violation Phase bs in Tagged Bs → J/ΨΦ Decays • Likelihood expression predicts better sensitivity to bs but still double minima • due to symmetry: • Study expected effect of tagging • using pseudo-experiments • Improvement of parameter • resolution is small due to limited • tagging power (eD2 ~ 4.5% • compared to B factories ~30%) • However, bs→ -bs no longer a • symmetry • → 4-fold ambiguity reduced to • 2-fold ambiguity • → allowed region for bs is reduced • to half pseudo experiment 2bs-DG likelihood profile ‘typical’ pseudo-exp strong phases can separate the two minima 2Dlog(L) = 2.3 ≈ 68% CL 2Dlog(L) = 6.0 ≈ 95% CL un-tagged tagged
CP Violation Phase bs in Tagged Bs → J/ΨΦ Decays • Likelihood expression predicts better sensitivity to bs but still double minima • due to symmetry: • Study expected effect of tagging • using pseudo-experiments • Improvement of parameter • resolution is small due to limited • tagging power (eD2 ~ 4.5% • compared to B factories ~30%) • However, bs→ -bs no longer a • symmetry • → 4-fold ambiguity reduced to • 2-fold ambiguity • → allowed region for bs is reduced • to half pseudo experiment 2bs-DG likelihood profile another ‘typical’ pseudo-exp 2Dlog(L) = 2.3 ≈ 68% CL 2Dlog(L) = 6.0 ≈ 95% CL un-tagged tagged
CP Violation Phase bs in Tagged Bs → J/ΨΦ Decays • Both DØ and CDF results fluctuate in the same direction 1-2s from SM prediction • ( Φs = -2bs ) strong phases constrained to B factories measurements in B0→ J/Ψ K*0→ unique minimum -2bs = • - Standard Model probability • CDF: 7%, ~1.8s DØ: 6.6%, ~1.8s • http://www-cdf.fnal.gov/physics/new/bottom • 080724.blessedtagged_BsJPsiPhi_update_prelim/arXiv:/0802.2255 • Recent DØ analysis shows consistency of strong phase and amplitudes in Bs →J/ΨΦ and B0 → J/Ψ K*0 and supports the strong phase constraint (arXiv:0810.0037v1)
ideal 95% CL real 95% CL 1 - CL 0.05 2Dlog(L) Non-Gaussian Regime • - In ideal case (high statistics, Gaussian likelihood), to get the 2D 68% (95%) C.L. • regions, take a slice through profile likelihood at 2.3 (6) units up from minimum • - In this analysis integrated likelihood ratio • distribution (black histogram) • deviates from the ideal c2 distribution • (red continuous curve) • To get 95% CL need to go up ~7 instead of 6 • units from minimum • - Procedure used by both CDF and DØ • From pseudo experiments find that • Gaussian regime is indeed reached as • sample size increases
ideal 95% CL real 95% CL real 95% CL + syst error 1 - CL 0.05 2Dlog(L) CDF Systematics • - At CDF, systematic uncertainties studied by varying all nuisance parameters +/- 5 s from observed values and repeating LR curves (dotted histograms) • Nuisance parameters: • lifetime, lifetime scale factor uncertainty, • strong phases, • - transversity amplitudes, • - background angular and decay time • parameters, • - dilution scale factors and tagging • efficiency • - mass signal and background • parameters • - … • - Take the most conservative curve (dotted • red histogram) as final result
Comparison Between CDF and DØ • - DØ releases constraints on strong phases → double minimum solution • CDF and DØ are in good agreement and both favor negative values of Φs = -2bs • (positive values of bs)
Combining CDF and DØ Results • HFAG combines old CDF (1.4 fb-1, 1.5 s from SM) and DØ (2.8 fb-1, 1.7 s from SM) results • yield a 2.2 s deviation from SM (similar results found by UTFit and CKM collaborations ) • The latest CDF analysis (2.8 fb-1, 1.8 s from SM) not yet included, but will slightly • increase the tension w.r.t. SM expectation
8 fb-1 6 fb-1 CDF only Probability of 5σ observation CDF+DØ (assume twice CDF) bs (radians) bs (radians) Future • CPV in Bs system is one of the main topics in LHCb B Physics program → will measure bs with great precision • Meanwhile Tevatron can search for anomalously large values of bs • Shown results with 2.8 fb-1, but 4 fb-1 already on tape to be analyzed soon • Expect 6/8 fb-1 by the end of 2009/2010 If bs is indeed large combined CDF and DØ results have good chance to prove it
Conclusions • Measurements of CPV in Bs system done by both CDF and DØ • Significant regions in bs space are ruled out • Best measurements of Bs lifetime and decay width difference DG • Both CDF and DØ observe 1-2 sigma bs deviations from SM predictions • Combined HFAG result 2.2 s w.r.t SM expectation • Interesting to see how these effects evolve with more data
Analysis • Ingredients: • Signal reconstruction • B flavor identification (tagging) • Angular analysis • Maximum likelihood fit • Statistical analysis
e, m, t u, c, t W W d’, s', b’ neutrino mixing matrix connects neutrino mass and weak eigenstates ne, nm, nt Introduction • Charge Parity violation (CPV) is a necessary ingredient to explain matter - antimatter asymmetry in Universe • CP symmetry is broken in Nature by the weak interaction • Weak interaction Lagrangean is not invariant under CP transformation • → due to complex phases in mixing matrices that connect up-type fermions with down-type fermions via W bosons: Cabibbo Kobayashi Maskawa (CKM) quark mixing matrix transforms quark mass eigenstates into weak eigenstates
Why Look for CPV in Bs System ? • CP violation has been measured in various Kaon and B-meson decays • 1. Indirect CP violation in the kaon system (eK) • 2. Direct CP violation in the kaon system e’/e • 3. CP Violation in the interference of mixing and decay in B0 → J/y K0. • 4. CP Violation in the interference of mixing and decay in B0->h’K0 • 5. CP Violation in the interference of mixing and decay in B0->K+K-Ks • 6. CP Violation in the interference of mixing and decay in B0->p+p- • 7. CP Violation in the interference of mixing and decay in B0->D*+D- • 8. CP Violation in the interference of mixing and decay in B0->f0K0s • 9. CP Violation in the interference of mixing and decay in B0->yp0 • 10. Direct CP Violation in the decay B0K-p+ • 11. Direct CP Violation in the decay B rp • 12. Direct CP Violation in the decay B p+p- • - CKM matrix well constrained • Within the SM framework, CP violation in the quark sector is orders of magnitude too • small to explain the matter - antimatter asymmetry • Only place left to find large CP violation without invoking new physics is lepton • sector in long baseline neutrino oscillation experiments • … or we can look for non-SM sources of CP violation • Ideal place to look for non-SM CPV is the neutral Bs meson system
b g b g g Gluon Splitting q b g Flavor Creation (annihilation) g Flavor Creation (gluon fusion) b g q b b b q q Flavor Excitation B Physics at the Tevatron b - Mechanisms for b production in pp collisions at 1.96 TeV - At Tevatron, b production cross section is much larger compared to B-factories → Tevatron experiments CDF and DØ enjoy rich B Physics program - Plethora of states accessible only at Tevatron: Bs, Bc, Λb, Ξb, Σb… → complement the B factories physics program - Total inelastic cross section at Tevatron is ~1000 larger than b cross section → large backgrounds suppressed by triggers that target specific decays
CDF Selection of Bs Signal Using ANN • NN maximizes S/√(S+B), trained on MC for signal and mass sidebands for background • - Variables used by NN • - B0s : use pT and vertex quality • - J/ψ : use pT and vertex prob. • - Φ : use mass and vertex quality • PID (dE/dx + TOF) for Kaons from Φ • …
CDF Tagging Calibration and Performance • OST calibrated on B+/- →J/Ψ K+/- • SST calibrated on MC, but checked on Bs mixing measurement correct tag probability = (1 + dilution) / 2 OST efficiency = 96 +/- 1% dilution = 11 +/- 2% SST efficiency = 50 +/- 1% dilution = 27 +/- 4%
Flavor Tagging • - Tevatron: b-quarks mainly produced in b anti-b-pairs • → flavor of the B meson at production inferred with • - OST: exploits decay products of other b-hadron in the event • SST: exploits the correlations with particles produced in fragmentation • Output: decision (b-quark or anti-b-quark) and probability the decision is correct • Similar tagging power for both CDF and DØ ~4.5% (compared to ~30% at B factories)
CDF Angular Analysis • CP even and CP odd final states have different angular distributions • → use angles r = (,,)to separate CP even and CP odd components • Detector acceptance distorts the theoretical distributions • → determine 3D angular efficiency functions from simulation and check in data • Example 2D and 1D angular efficiency projections in f and cos() (3rd dimension, , • not shown) - deviations from flat indicate detector effects
CDF Background Angular Analysis • Angular background distributions are determined from data Bs mass sidebands • Notice consistency between background angular distributions and detector sculpting • efficiencies on previous page
CDF Cross-check on B0 → J/Ψ K*0 B0→J/ψK*0 : high-statistics test of angular efficiencies and fitter • Not only agree with latest BaBar results,(PRD 76,031102 (2007) ) but also competitive
3.59 ± 0.08 ± 0.08 DØ Cross-check on B0 → J/Ψ K*0 - Consistency of amplitudes and strong phase between Bs and B0 arXiv:0810.0037v1
Analysis without Flavor Tagging - Drop information on production flavor - Simpler but less powerful analysis • Still sensitive to CP-violation phase bs • Suited for precise measurement of width-difference and average lifetime
CDF bs in Untagged Analysis • - Fit for the CPV phase • Biases and non-Gaussian estimates in pseudo-experiments • Strong dependence on true values for biases on some fit parameters. fits on simulated samples a) Dependence on one parameter in the likelihood vanishes for some values of other parameters: e.g., if ΔΓ=0, δ┴ is undetermined b) L invariant under two transformations: → 4 equivalent minima
bs in Untagged Analysis • Irregular likelihood and biases in fit • → CDF quotes Feldman-Cousins confidence regions: Standard Model probability 22% • DØ quotes point estimate: Φs = -0.79 +/- 0.56 (stat) +0.14-0.01 (syst) • Symmetries in the likelihood → 4 solutions are possible in 2bs-DG plane • CDF: 90%, 95% C.L 1.7 fb-1 DØ: 39% C.L. 1.1 fb-1 Phys. Rev. Lett. 100, 121803 (2008) PRL 98, 121801 (2007)
CDF External Constraints in Tagged Analysis (1.4 fb-1) • Spectator model of B mesons suggests that Bs and B0 have similar lifetimes • and strong phases • Likelihood profiles with external constraints from B factories: • constrain strong phases: constrain lifetime and strong phases: • External constraints on strong phases remove residual 2-fold ambiguity
Effect of Dilution Asymmetry on bs • Effect of 20% b-bbar dilution asymmetry is very small B+→ J/Ψ K+ B-→ J/Ψ K-
L = 1.7 fb-1 Comparison Between CDF Tagged and Untagged Analysis • Allowed parameter space significantly reduced by using Bs flavor tagging • Negative bs values are suppressed
CDF Comparison Between 1.4 fb-1 and 2.8 fb-1 • dotted line = 1.4 fb-1 • solid line = 2.8 fb-1
ideal 95% CL real 95% CL 1 - CL 0.05 2Dlog(L) Non-Gaussian Regime • - In ideal case (high statistics, Gaussian likelihood), to get the 2D 68% (95%) C.L. • regions, take a slice through profile likelihood at 2.3 (6) units up from minimum • - In this analysis integrated likelihood ratio • distribution (black histogram) • deviates from the ideal c2 distribution • (red continuous curve) • To get 95% CL need to go up ~7 instead of 6 • units from minimum • - Procedure used by both CDF and DØ • From pseudo experiments find that • Gaussian regime is indeed reached as • sample size increases
ideal 95% CL real 95% CL real 95% CL + syst error 1 - CL 0.05 2Dlog(L) CDF Systematics • - At CDF, systematic uncertainties studied by varying all nuisance parameters +/- 5 s from observed values and repeating LR curves (dotted histograms) • Nuisance parameters: • lifetime, lifetime scale factor uncertainty, • strong phases, • - transversity amplitudes, • - background angular and decay time • parameters, • - dilution scale factors and tagging • efficiency • - mass signal and background • parameters • - … • - Take the most conservative curve (dotted • red histogram) as final result
CDF 1D Profile Likelihood bs is within [0.28, 1.29] at the 68% CL
Another Related Puzzle ? - Direct CP in B+K+p0 and B0 K+p- should have the same magnitude. - But Belle measures (4.4 s) - Including BaBar measurements: > 5s Lin, S.-W. et al. (The Belle collaboration) Nature 452,332–335 (2008) • W-S Hou explains above effects by introducing the fourth fermion generation and • predicts large bs value (arXiv:0803.1234v1)