Download
1 / 18
180 likes | 187 Views
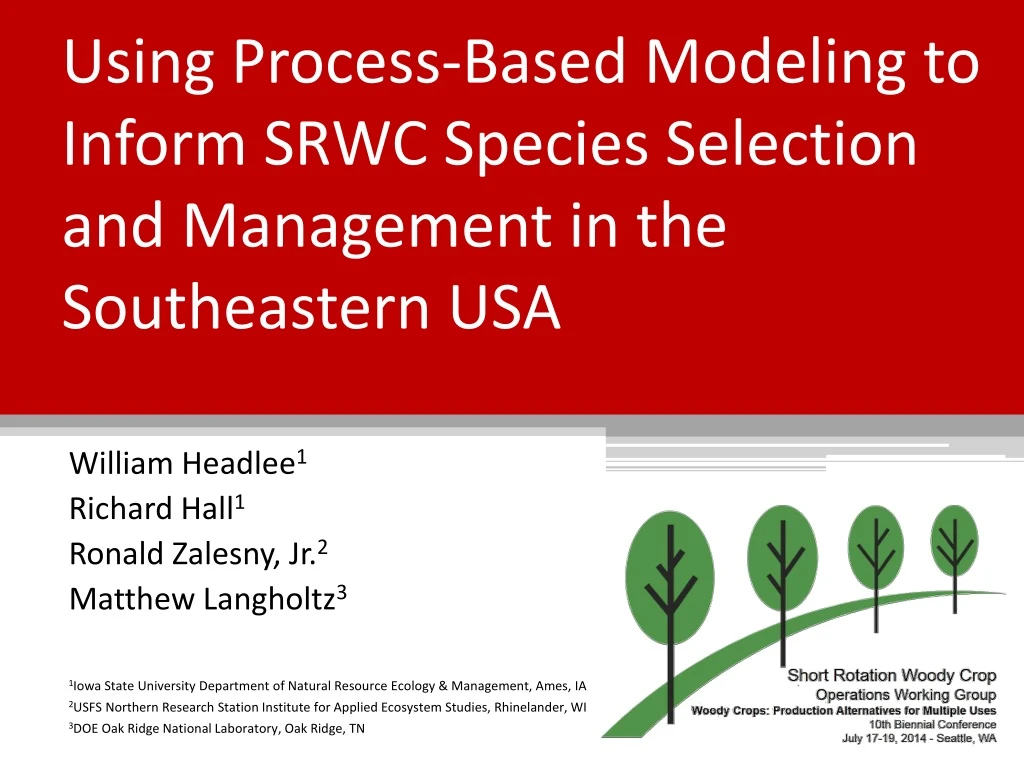
Using Process-Based Modeling to Inform SRWC Species Selection and Management in the Southeastern USA. William Headlee 1 Richard Hall 1 Ronald Zalesny , Jr. 2 Matthew Langholtz 3 1 Iowa State University Department of Natural Resource Ecology & Management, Ames, IA

E N D
Using Process-Based Modeling to Inform SRWC Species Selection and Management in the Southeastern USA William Headlee1 Richard Hall1 Ronald Zalesny, Jr.2 Matthew Langholtz3 1Iowa State University Department of Natural Resource Ecology & Management, Ames, IA 2USFS Northern Research Station Institute for Applied Ecosystem Studies, Rhinelander, WI 3DOE Oak Ridge National Laboratory, Oak Ridge, TN
Modeling Short-Rotation Woody Crops • Project overview • Goals and objectives • Model description • Current progress • Literature review and data compilation • Model fitting • Mapping productivity • Economic analyses
Poplars (photo R. Zalesny) Loblolly pine (photo W. Ciesla) Eucalypts (photo D. Haugen) Goals & Objectives • Southeastern USA has suitable climate for a variety of SRWCs • Which woody crops are best-suited for different combinations of climate and soil conditions? • Process-based models allow for comparisons of crops, in lieu of extensive side-by-side testing • 3-PG model already calibrated for three candidate SRWCs (poplars, loblolly pine, and eucalypts)
Goals & Objectives (continued) • Primary objective: Within range of overlap, model productivity and compare economics for each species on marginal lands. • Additional objective: Develop methods to account for differences in silvicultural practices (site prep, weed control, fertilization, etc). Geographic ranges for (A) poplars, (B) loblolly pine, and (C) eucalypts. Adapted from USDA Plant Hardiness Zone map.
Overview of 3-PG Model • “Physiological Principles Predicting Growth” model (Landsberg& Waring 1997) accounts for key drivers of growth • Available resources (sunlight, water, nutrients) • Tree physiology (resources → biomass) • Uses site-specific inputs for climate and soils to estimate available pools of key resources • Sunlight (solar radiation) • Water (precipitation, temperature, soil water holding capacity, water table depth, etc.) • Nutrients (site fertility) Sunlight Nutrients Water
CO2 Leaf fall Turnover Overview of 3-PG (continued) • Species-specific physiological parameters determine the amount of photosynthate produced from available resources, and its allocation to tree components • Quantum canopy efficiency • Respiration • Leaf litterfall rate • Root turnover rate • Biomass partitioning (stem, branches, foliage, bark, roots) • The list goes on… 60 parameters in all!
Literature Review & Data Compilation • Identified 57 previously-published growth and yield studies for crops of interest in MS, AL, FL, GA, and SC • Contain 441 unique combinations of soils, management, planting density, etc. (stands)
Sunlight Nutrients Water Model Fitting • Use previously-published data to validate existing base calibrations for poplars (Headlee et al 2013), loblolly pine (Bryars et al 2013), and eucalypts (Sands 2004) • Accounting for differences in silvicultural practices • Planting density – direct input • Irrigation – roll into precipitation • All others – quantify responses with linear regression, roll into fertility rating
Model Fitting (continued) • Silviculture regression model asssumptions • Practices can influence slope and/or intercept of cumulative growth curve • Increasing application rates associated with diminishing rates of return 20% change in intercept and slope 20% change in intercept 20% change in slope Cumulative Growth Time
Model Fitting (continued) • Regression models based on typical cumulative growth function (Avery and Burkhart 2002) where “G” is cumulative growth, “a” is the intercept (growth ceiling), and “b” is the slope (sigmoid curve): • To predict impacts of treated stands (subscript T) relative to untreated controls (subscript C): • Log-transform and separate ∆a and ∆b into components for fertilizer (F), weed control (W), site preparation (S), pest control (P), and residuals (R):
Model Fitting (continued) • Silviculture linear regression – results • Responses varied by SRWC and growth parameter • Regression model fit (r2) ranged from 0.57 to 0.88
Model Fitting (continued) • Silviculture linear regression – examples • Eucalypt response to fertilization (Rockwood et al 2008) • Poplar response to site preparation (Francis 1982, Baker and Blackmon 1978) • Loblolly pine response to fertilization (Samuelson et al 2008 & 2004)
Model Fitting (continued) • Next step: validate previous model calibrations using growth data compiled from the literature • Fertility ratings estimated from regression models • Climate data (temperature, precipitation, etc.) from NOAA National Climatic Data Center • Soils data (water holding capacity, depth to water table, etc.) from NRCS soils database (SSURGO)
Mapping Productivity • Similar to previous poplar modeling, will focus efforts on suitable lands • “Marginal lands” as defined by NRCS Land Capability Classes (LCC) II-IV • Moorhead & Dangerfield (1998) found >95% of ag lands converted to woody crops in Georgia were LCC II-IV Source: Zalesny et al 2012
Economic Analyses • Model’s productivity estimates will be used to compare: • Mean annual increments (MAI) for each SRWC under different combinations of climate and soils • Optimum rotation ages (maximum MAI) • Land expectation values (LEVs) • Most economically feasible SRWC (maximum LEV)
Summary • Literature Review • Identified 57 studies containing sufficient data to model 441 unique combinations of site conditions and silvicultural practices • Model Fitting • Used linear regression to quantify SRWC responses to silvicultural practices • Validating model with published yield data using fertility rating estimates, NOAA climate data, and NRCS soils data • Mapping Productivity • Will focus on marginal lands (NRCS Land Capability Classes II-IV) • Economic Analyses • Will compare crop MAIs, optimum rotation ages, and LEVs
References • Avery TA, Burkhart HE (2002) Growth and yield models. In: Forest Measurements, 5th ed. McGraw-Hill, New York, pp 352-385 • Baker JB, Blackmon BH (1978) Summer fallowing – a simple technique for improving old-field sites for cottonwood. Forest Service Research Paper SO-142. 5 p. • BryarsC, Maier C, Zhao D, Kane M, Borders B, Will R, Teskey R (2013) Fixed physiological parameters in the 3-PG model produced accurate estimates of loblolly pine growth on sites in different geographic regions. Forest Ecology and Management 289: 501-514 • Francis JK (1982) Fallowing for cottonwood plantations: benefits carry to rotation’s end. In: Proc. North American Poplar Council 19th Annual Mtg. p 1-7. • Headlee WL, Zalesny RS, Donner DM, Hall RB (2013) Using a process-based model (3-PG) to predict and map hybrid poplar biomass productivity in Minnesota and Wisconsin, USA. BioEnergy Research 6: 196-210 • LandsbergJJ, Waring RH (1997) A generalised model of forest productivity using simplified concepts of radiation-use efficiency, carbon balance and partitioning. Forest Ecology and Management 95: 209-228 Rockwood DL, Carter DR, Stricker JA (2008) Commercial tree crops for phosphate mined lands. University of Florida Publication 03-141-225. 86 p. Samuelson LJ, Butnor J, Maier C, Stokes TA, Johnsen K, Kane M (2008) Growth and physiology of loblolly pine in response to long-term resource management: defining growth potential in the southern United States. Canadian Journal of Forest Research 38: 721-732. Samuelson LJ, Johnsen K, Stokes T (2004) Production, allocation, and stemwood growth efficiency of Pinustaeda stands in response to 6 years of intensive management. Forest Ecology and Management 192: 59-70. Sands PJ (2004) Adaptation of 3 PG to novel species: guidelines for data collection and parameter assignment. Technical Report 141, CRC for Sustainable Production Forestry, Hobart, Australia. ZalesnyRS, Donner DM, Coyle DR, Headlee WL (2012) An approach for siting poplar energy production systems to increase productivity and associated ecosystem services. Forest Ecology and Management 284: 45-58
Thank you for your time! • Funding and other support provided by: • USDA-NIFA Agriculture and Food Research Initiative (CRIS 2013-03276) • USFS-NRS Institute for Applied Ecosystem Studies (IAES) • Technical support • Sue Lietz (IAES) • Literature review assistance/suggestions • Dave Coyle • John Stanturf • Lynne Wright • Questions?