Download
1 / 15
150 likes | 277 Views
6.7 – Percent and Problem Solving: Interest. Simple Interest:. Time . Simple Interest. = . Principal. Interest Rate . . . Principal: $600.00. Interest Rate: 4%. = 0.04. Time = 1 year. Interest = $600.00 . 0.04. Interest = $24.00. Principal. Interest. Total Amount. = . +.

E N D
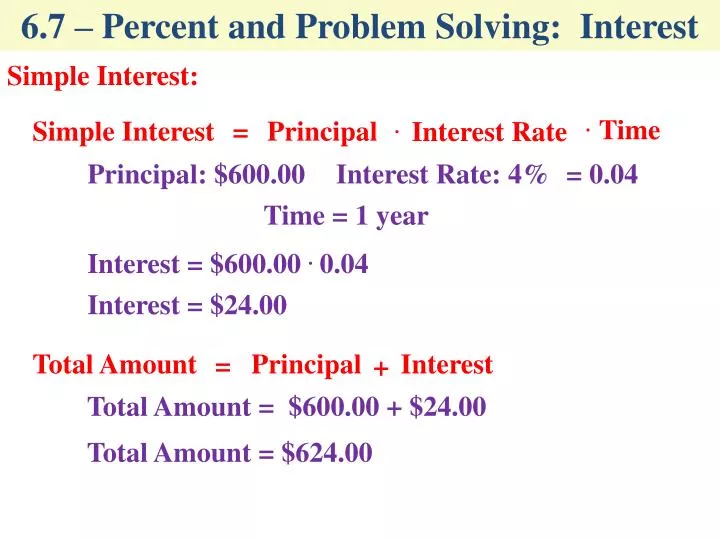
6.7 – Percent and Problem Solving: Interest Simple Interest: Time Simple Interest = Principal Interest Rate . . Principal: $600.00 Interest Rate: 4% = 0.04 Time = 1 year Interest = $600.00 . 0.04 Interest = $24.00 Principal Interest Total Amount = + Total Amount = $600.00 + $24.00 Total Amount = $624.00
6.7 – Percent and Problem Solving: Interest 6.7 – Percent and Problem Solving: Interest Find the simple interest and the total amount paid on a five year loan of $875 at a rate of 7%. Total Amount Simple Interest 875.00 + 306.25 $875 7% 5 . . 1181.25 875 0.07 5 . . $1181.25 61.25 5 . 306.25 $306.25
6.7 – Percent and Problem Solving: Interest A student borrowed $1500 for nine months on a credit card. The interest on the credit card is 20%. How much interest was paid and what was the total amount? Total Amount Simple Interest 1500.00 + 225.00 9/12 $1500 20% . . 1725.00 0.2 0.75 $1500 . . $1725.00 300 0.75 . 225.00 $225.00
6.7 – Percent and Problem Solving: Interest If $2100 is invested at a simple interest rate of 13% for six months, what is the value of the investment at the end of the six month period? Total Amount Simple Interest 2100.00 + 136.50 6/12 $2100 13% . . 2236.50 0.13 0.5 $2100 . . $2236.50 273 0.5 . 136.50 $136.50
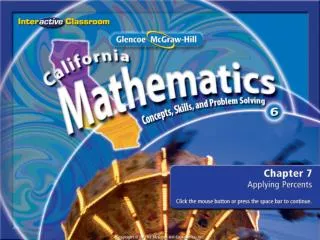
7.1 – Reading Pictographs and Bar Graphs Pictograph: A graph that uses symbols to represent the data. Key or Legend: Explains the meaning of the symbol used in the pictograph.
7.1 – Reading Pictographs and Bar Graphs 25 How many people ordered cheese pizza? pepperoni What kind of pizza had the most orders? What 2 kinds of pizza had the same number of orders? cheese and sausage
7.1 – Reading Pictographs and Bar Graphs What is the second most popular apple in the store? Jonathan How many Golden Delicious apples are carried by the store? 25
7.1 – Reading Pictographs and Bar Graphs Bar Graph: A graph that uses vertical or horizontal bars to represent data. Each bar requires a label to identify it. Scale: A horizontal or vertical number line used to read the data from the bar graph.
7.1 – Reading Pictographs and Bar Graphs 30 How many students watch 12–14 hours of TV? 22 How many watch 6-8 hours? What range is the largest and how many students watch? 9-11 hours with 32 students
7.2 – Reading And Drawing Circle Graphs Circle Graph: A graph that uses a circle to represent the data as a whole. Each sector (pie piece) shows a category and its relative size to the other categories. The most common data presentation is as a percent. 45% 20% 2.5% 2.5% 15% 15%
7.2 – Reading And Drawing Circle Graphs Circle Graph: A graph that uses a circle to represent the data as a whole. Each sector (pie piece) shows a category and its relative size to the other categories. Another presentation is to show the data for each category. 90 40 5 5 30 30
7.2 – Reading And Drawing Circle Graphs If percentages are used, there is no way to calculate the numerical size of each category without a sample size.
7.2 – Reading And Drawing Circle Graphs A Family's Weekly Expenditure:Mortgage, Food and Fuel
7.2 – Reading And Drawing Circle Graphs A Family's Weekly Expenditure: Mortgage, Food and Fuel
7.2 – Reading And Drawing Circle Graphs A Family's Weekly Expenditure: Mortgage, Food and Fuel