Download
1 / 8
80 likes | 236 Views
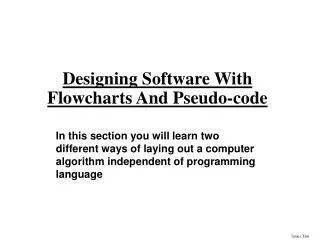
Flow Control Analysis & Design Tool: Flowcharts. Flowchart - a graphical way of writing algorithms Rectangle is used for calculations Parallelogram is used for input and output Circle is used as connector Diamond is used as decision

E N D
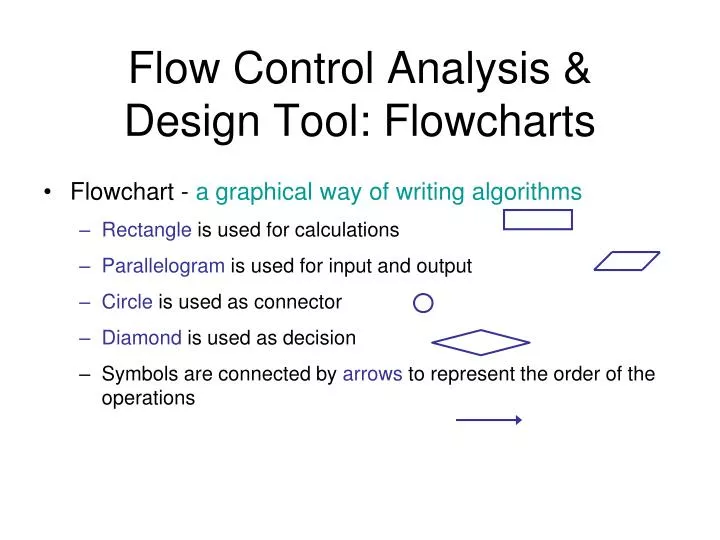
Flow Control Analysis & Design Tool: Flowcharts • Flowchart - a graphical way of writing algorithms • Rectangle is used for calculations • Parallelogram is used for input and output • Circle is used as connector • Diamond is used as decision • Symbols are connected by arrows to represent the order of the operations
Total = Cost + Tax Num = Num + 1 Flowcharts Symbols: Calculations • Calculations (e.g. arithmetic expressions) are shown in rectangles • Examples: • Total = Cost + Tax • Num = Num + 1 (add one to the current value of Num and make that the new value of Num)
READ Num WRITE Num Flowcharts Symbols: Input/Output • Data input and output are shown in parallelograms • Input means a read operation of data from a peripheral device to memory (e.g. a user typing in data at a keyboard) • Output means a write operation of data to a peripheral device from memory (e.g. data displayed to the monitor)
False Gross > 50000 Rate = 0.28 True Rate = 0.31 Flowcharts Symbols: Decisions • Decisions are shown within diamonds and specify a condition to be tested • Based on the condition being TRUE or FALSE, the next operation will be determined • A decision is composed of : • A condition • An operation to be done if condition is TRUE • Possibly an operation to be done if condition is FALSE
start input num square = num x num print square stop Flowcharts Symbols: Start and End • Every algorithm starts somewhere and terminates somewhere • Every flowchart must have one start symbol and one end symbol • Start and end symbols are ovals • A start symbol denotes the start of the algorithm • An end symbol indicates the algorithm has terminated
start prompt Age1 input Age1 prompt Age2 input Age2 Allow1 = Age1 x Rate Allow2 = Age2 x Rate Print Allow1 Print Allow2 stop Sequential AlgorithmFlowchart • Pseudocode Algorithm: • PROMPT for Age of Child1 • READ Age of Child1 • PROMPT for Age of Child2 • READ Age of Child2 • CALCULATE Allowance for Child1 = Age of Child1 x Rate • CALCULATE Allowance for Child2 = Age of Child2 x Rate • DISPLAY Allowance for Child1 • DISPLAY Allowance for Child2
start prompt Age input Age TRUE FALSE Age < 10 Allow = Age x OlderRate Allow = Age x YoungRate Print Allow stop Selection AlgorithmFlowchart • Previous Pseudocode Algorithm: • PROMPT for Age • READ Age • IF Age less than 10 • THEN CALCULATE Allowance = Age x YoungRate • ELSE CALCULATE Allowance = Age x OlderRate • DISPLAY Allowance
start KidsPaid = 0 Total = 0 KidsPaid < 3 TRUE FALSE Prompt Age Read Age Display Total Calc Allowance stop Add Allowance to Total Increment KidsPaid Looping AlgorithmFlowchart • Previous Pseudocode Algorithm: • Set KidsPaid to 0 • Set Total to 0 • WHILE KidsPaid < 3 DO • PROMPT for Age • READ Age • CALCULATE Allowance = Age x Rate • ADD Allowance to Total • INCREMENT KidsPaid • DISPLAY Total