Download
1 / 17
170 likes | 174 Views
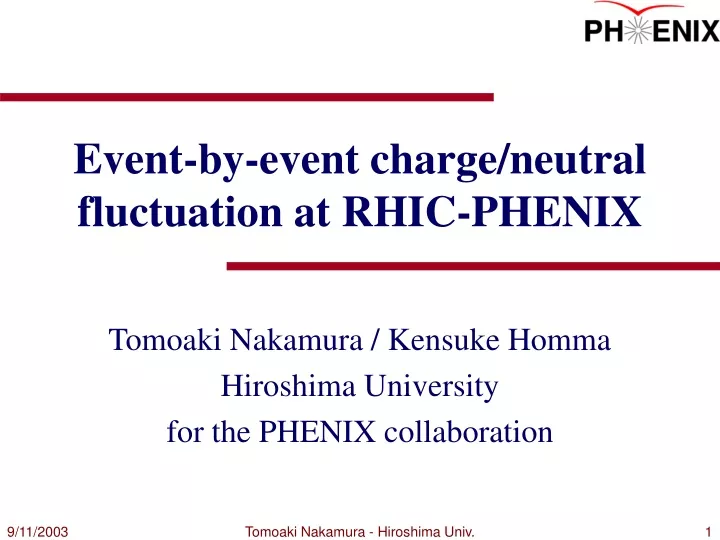
Event-by-event charge/neutral fluctuation at RHIC-PHENIX. Tomoaki Nakamura / Kensuke Homma Hiroshima University for the PHENIX collaboration. Why fluctuation ?. Measure maximum deviation size in homogeneous flux in our method. The Microwave Sky image from the WMAP Mission

E N D
Event-by-event charge/neutral fluctuation at RHIC-PHENIX Tomoaki Nakamura / Kensuke Homma Hiroshima University for the PHENIX collaboration Tomoaki Nakamura - Hiroshima Univ.
Why fluctuation ? Measure maximum deviation size in homogeneous flux in our method The Microwave Sky image from the WMAP Mission http://map.gsfc.nasa.gov/m_mm.html • Fluctuations carries information at early universe in cosmology despite of the only single Big-Bang event. • Why don’t we use the genuine event-by-event information by getting all phase space information to study evolution of dynamical system in Heavy Ion collisions ? • We can firmly search for interesting fluctuations with more than million times of mini Big-Bangs. Tomoaki Nakamura - Hiroshima Univ.
Physics motivation Fluctuation of charged and neutralπ as charge/neutral balance is a possible probe to extract information at the chiral phase transition (…DCC scenario). Hadronization WMAP have seen the fluctuation of CMBat the recombination. Tomoaki Nakamura - Hiroshima Univ.
Au+Au √sNN = 200GeV at PHENIX • Using magnetic field-off • Charged Track Drift chamber, Pad chamber1 with BBC vertex • Photon ClusterElectro-magnetic calorimeter • Cluster shower shape • Time of flight • association cuts by tracks • Precisely data quality assurance was necessary to reject detector effect! Tomoaki Nakamura - Hiroshima Univ.
Event sample and a normal event • Charged track • Photon cluster Charged tracks Photon clusters 2.4 standard deviation ~3,000 events accumulated Tomoaki Nakamura - Hiroshima Univ.
Observable original signal 0 η, differential maximum differential 0 Balance Tomoaki Nakamura - Hiroshima Univ.
How to extract region? High resolution extract this region Low resolution η Tomoaki Nakamura - Hiroshima Univ.
High energy cosmic ray experiment and PHENIX PHENIX 7.24 standard deviation ○: Photon + : Charged Particle • Charged track • Photon cluster J. J. Lord and J. Iwai. Int. Conference on High Energy Physics, TX, 1992 Can DCC scenario explain these events or something else? Tomoaki Nakamura - Hiroshima Univ.
Maximum differential balance distributions Work in Progress δBmax [arbitrary unit] • δBmax distribution (each centrality:10%) with base line fluctuation • black : binomial sample, 100 times larger statistics than real data obtained by hit map • red : data Tomoaki Nakamura - Hiroshima Univ.
N-participant dependence of the event fraction above 5% significance level Data M.B. 92.2%(550,426 events) Work in Progress [arbitrary unit] HIJING 1.35 quench on + full reconstruction (67,373 events) Tomoaki Nakamura - Hiroshima Univ.
Summary and plan • Fraction of events above 5% significance level to exclude binomial fluctuation with respect to minimum bias events increases as N-participants increases. • Known fluctuations measured by the other experimental observables in our experiment will be parameterized and tested by our observable separately to investigate the source of fluctuations. • Jets : two particle correlations and mean pT fluctuation • Flow effect (would be negligible): V2 analysis • Bose-Einstein correlation : subdivided multiplicity distributions with Negative Binomial Distribution Tomoaki Nakamura - Hiroshima Univ.
Back up slide Tomoaki Nakamura - Hiroshima Univ.
Baseline fluctuation DATA base line by binomial sample 5% S.L after subtraction • Yellow band is one of the systematic error coming from ambiguity of limit value as 95% significance level. • Baseline fluctuation have also a feature of enhancement of fraction at the low multiplicity events and at small resolution level. This algorism can not select large window at the low multiplicity. This is a feature of nature. So we subtracted the baseline fluctuation made by binomial based on hit map. Tomoaki Nakamura - Hiroshima Univ.
level-by-level Tomoaki Nakamura - Hiroshima Univ.
wavelet algorism (2 scale relation) φ(x) 0.7 + x -0.7 1 φ(2x) 1 φ(2x-1) = ψ(x) 0.7 1 x 1 x - -1 x -1 -0.7 Level j-1: 2j-1 bins Level j : 2jbins Scaling function Wavelet function φ(2x) = 1/√2 {φ(x) + ψ(x) } φ(2x-1) = 1/√2 {φ(x) - ψ(x) } Tomoaki Nakamura - Hiroshima Univ.
Multi resolution analysis Signal j=4 22 20 j : resolution level (domain size) k : k-th bin in rapidity c jk : coefficients of φ d jk : coefficients of ψ d jk corresponds to subtraction between two neighboring bins except scaling factor φ ψ c jk d jk j=3 + j=2 + j=1 + j=0 + k k Tomoaki Nakamura - Hiroshima Univ.
Window shift A symmetric structure appears in wrong level Shift the start bin at each resolution level. Find djk max among all of levels. This can determine the level (domain size) with the largest deviation size. djk is lower should appear here ! Tomoaki Nakamura - Hiroshima Univ.