Download
1 / 46
710 likes | 1.22k Views
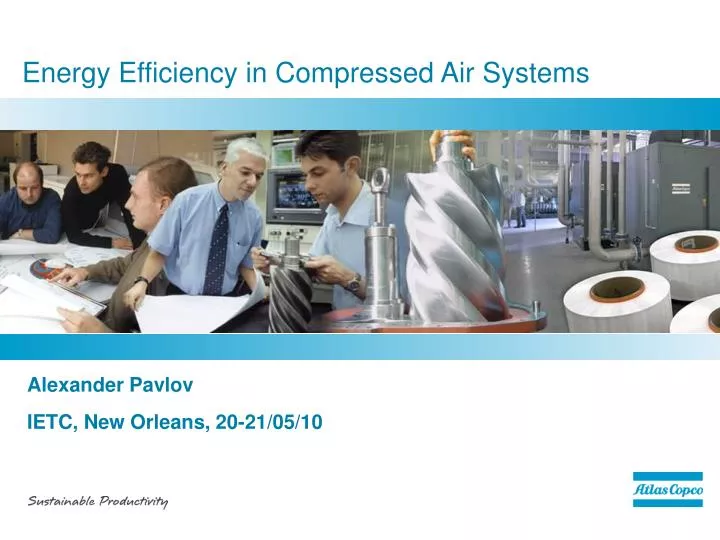
Energy Efficiency in Compressed Air Systems. Alexander Pavlov IETC, New Orleans, 20-21/05/10. Atlas Copco in a Snapshot . A world-leading provider of industrial productivity solutions .

E N D
Energy Efficiency in Compressed Air Systems Alexander Pavlov IETC, New Orleans, 20-21/05/10
Atlas Copco in a Snapshot A world-leading provider of industrial productivity solutions. Products and services range from compressed air and gas equipment, generators, construction and mining equipment, industrial tools and assembly systems, to related aftermarket and rental. In close cooperation with customers and business partners, Atlas Copco delivers sustainable solutions for increased productivity through innovative products and services. Headquartered in Sweden, the Group’s global reach spans more than170 markets. In 2009 Atlas Copco had 30 000 employees and annual revenues of approximately BSEK 64 (BEUR 6.0).
The Atlas Copco Organization Board of Directors President and CEO Executive Group Management and Corporate Functions CompressorTechnique Construction and Mining Technique IndustrialTechnique Oil-free Air Industrial Air Portable Air Specialty Rental Gas and Process Compressor Technique Service Airtec Underground RockExcavation Surface DrillingEquipment Drilling Solutions Secoroc Construction Tools Road Construction Equipment Geotechnical Drillingand Exploration Rocktec Atlas Copco Tools and Assembly SystemsMotor Vehicle Industry Atlas Copco Toolsand Assembly Systems General Industry Chicago Pneumatic Tooltec Customer Centers and Service Providers
Worldwide Presence Production sites
Value of Energy in Compressed Air Systems 70% to 80% of life cycle costs is energy In EU compressed air accounts for 10%of the energy consumed by industry 1 bar lower in pressure, reduces energy by 7% Typically, after 5 years leakages can take 20% of the total air consumption Some useful facts and figures Energy Savings Investment 12% Maintenance 15% Installation 3% Energy consumption 70%
CO2 emissions – the big picture Atlas Copco focus (95% +) • Design of product • Energy use • Re-use • Logistics • Less electricity consumption • Design of product
Why Atlas CopcoSaving energy is our way of life A century of innovation in energy saving features Over 400 patents
EU electricity consumption in compressed air Real consumption in CAS TWh Share of electricity In EU the compressed air accounts for 10%of the energy consumed by industry, 80 TWh/year Source: Compressed air systems in the European Union, 2001, study by Fraunhofer Institute, ADEME, ECE, University of L’Aquila
Potential contribution to energy savings Source: Compressed air systems in the European Union, 2001, study by Fraunhofer Institute, ADEME, ECE, University of L’Aquila 32.9 % = 30.5 TWh/yr = 0.7 million tonnes of CO²/yr
From products to solutionsThe unique approach Customer needs Superior solutions demand assessment energy recovery Total energysaving concept core technology optimizationof the room drive technology energy saving accessories
Customer needs Superior solutions The Energy Circle demand assessment energy recovery core technology optimizationof the room drive technology energy saving accessories
Demand assessment • System audit: • Flow measurement • Pressure measurement • Power measurement • Report: • Simulation of optimal compressor installation • Simulation of central control system • Potential energy savings Overall system design
Leak detection • Ultrasound leak detection • Report • Location • Leak flow • Equivalent energy loss
System assessmentAirScan -Tools Flow Leak detection Dewpoint measurement Measurement box Power/logging device Temperature Hot tapping VIP sens Flow measurement output
Customer needs Superior solutions The Energy Circle demand assessment energy recovery core technology optimizationof the room drive technology energy saving accessories
Products Best compression and treatment technologies under one roof Oil-free scroll compressors 1-15 kW Oil-free tooth compressors 15-45 kW Oil-free screw compressors 55-900 kW Oil-injected screw compressors 5-500 kW Turbo compressors 500-2500 kW Matching air treatment equipment Dryers,filters,drains,separators,etc ES – energy saving central controllers Optimization, monitoring, control
18 kW 55 kW 750 kW Energy Savings Atlas Copco has all the technologies available Specific energy J/l (Hp/cfm) scroll tooth centrifugal screw Power (flow) Appropriate selection can save a lot of energy
System design : innovations in screw elements Specific Energy (J/l , Hp/cfm) 11kW 22kW 30kW 55kW 90kW 132kW 200kW 300kW 3-5% 3% 5-6% 1 10 (21.2) 100 (212) 1000 (2,120) FAD l/s (cfm) 2008 1995 - 2003 2000 - 2006 Before 1990
Customer needs Superior solutions The Energy Circle demand assessment energy recovery core technology optimizationof the room drive technology energy saving accessories
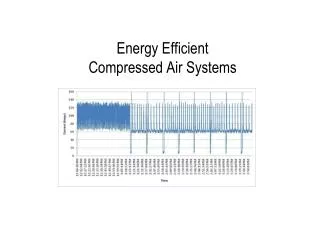
Typical air demand pattern l/s Monday Tuesday Wednesday 250 Thursday Friday 200 Saturday Sunday 150 100 Average use 50% 50 hour Energy Savings Measurement and simulation tools are available to calculate precise energy savings in a real environment
Excess energy Loaded pressure Unloaded system pressure T time Theory Actual T- time for complete system venting Energy savings with VSD Power consumption during transition from load to no load with traditional regulation
~80% Energy savings with VSD Power consumption during transition from load to no load with traditional regulation vs. VSD Power consumption GA45 L-NL at 50% 50 40 VSD 30 kW 20 10 0 0 20 40 60 80 100 120 140 160 180 200 220 240 260 seconds
18 Kw 55 Kw 750 Kw Energy cost per m3 of air at 7 bar(e) (100 psig) VSD technology can save up to 35% of energy $/M3 Specific energy J/L or $/M3 scroll tooth centrifugal screw Flow m3 / min VSD – Variable speed drives
Company A Company B Company C Company D Company E Others : mainly promoting free-standing Atlas Copco Widest integrated VSD range (from 7.5 to 900 KW) Our commitment to VSD technology 750 250 0 1000 kW 500
Customer needs Superior solutions The Energy Circle demand assessment energy recovery core technology optimizationof the room drive technology energy saving accessories
Efficiency – Air quality MD and XD dryers – energy-less air drying • Heat of compression is used for drying • No external energy or purge is required • Very low pressure drops Energy savings between 5 and 20% are possible !
Dryer energy consumption (-20oC, -4°F PDP) % of compressor power Type of dryer
Customer needs Superior solutions The Energy Circle demand assessment energy recovery core technology optimizationof the room drive technology energy saving accessories
com-pressor 4 com-pressor 3 com-pressor 2 com-pressor 1 PRESSURE BAND CASCADE CENTRAL CONTROL LOCAL CONTROL Net pressure Average pressure Required minimum pressure Time HIGH COSTS LOW COSTS Energy savings through optimization • ES controls the net pressure • Net pressure is guaranteed while compressors run at lowest required pressure • Lower pressure by 1 bar reduces energy by 7%
Pressure Time Pressure Time Automatic selection of “Best Size” compressor Big compressor • Net pressure drops fast • Net pressure drops slowly Small compressor
ES optimization VSD 2: ~50% VSD 2: 50% Flow Flow SER (J/l) VSD 1 VSD 2 Flow (l/s) Time Time Optimization of VSD compressors Local control VSD 2: ~ 70% Efficient? VSD 1: 30% VSD 1 VSD 2 SER (J/l) Flow (l/s)
ES optimization VSD 2: 50% Turbo 2: 80% (blow-off 0%) Turbo 1: 100% (blow-off 0%) SER (J/l) Turbo 2 Turbo 1 Blow-off Flow Flow VSD SER (J/l) Flow (l/s) Time Time Optimization of Turbo’s and VSD Local control VSD 2: 90% Turbo 2: 50% (blow-off ~20%) Efficient? Turbo 1: 100% (blow-off 0%) Turbo 2 SER (J/l) Turbo 1 Blow-off ….. ….. SER (J/l) VSD Flow (l/s)
Carbon ZeroThe unique approach The new milestone ‘Carbon Zero’ “net zero energy” Recovery demand assessment optimizationof the room core technology efficient air treatment drive technology
Type test of ZR 55-750 range with built-in energy recovery systems Comparison of the electrical energy consumption with heat energy recovered • Certified results • “100% of the electrical energy consumed could be recovered” • “ net power (energy) consumption of the ZR compressor with built-in energy recovery at specific design conditions is zero”
Introducing Carbon Zero Result – Net Zero energy consumption 10% losses in radiation, etc. 100% Electrical energy input converted to heat Direct energy recovery 90% 102 Energy in atmospheric air (latent heat) Atmospheric energy 12% 15% Released due to condensation in coolers
Carbon Zero principal build-upZR Energy recovery Recovered energy at 10 bar(e) (145 psig) LP element 9% HP element 12% Oil cooler Intercooler 37% Aftercooler 42% Thermostatic valve ZR Energy recovery 20-40°C (68-104°F) 70-90°C (158-194°F) ER control unit Water circuit
Components of the energy recovery systems Heat consumer Secondary cooling water system T H H ZR H H T H H H PI TI H H Control unit scope is within the dashed line. Outside is customer’s scope.
What makes ZR compressor unique • Compared to oil-injected screws • ZR compressors have much higher temperatures due to which they can recover 100% of the electrical energy as heat, under design conditions. Watercooled OIS can recover +/- 70% • Compared to turbos • Lower temperatures in turbos restrict energy recovery severely • Interstage energy recovery can create instability • At reasonable temperatures energy recovery is 30-35% • Compared to other oil-free screws • Others are not recovering energy from oil coolers and jackets, thus losing 20-25%. So energy recovery with competitors OFS could be at best 80%
Showers Space heating Boiler feed Applications
Example of savings with Carbon Zero Consider a ZR132 kW compressor and an energy recovery of 135 kW Heat equivalent per second = 135 kJ/s When using heating oil (HO) Calorific value = 41,200 kJ/l Boiler efficiency = 70% without recovery and 90% with recovery Heat generated per hour = 135 kJ/s x 3600 Fuel saved = 135 x 3600 / (41,200 x 0.9) = 13 l/h = 3.4 gal/h Cost of fuel = 0.5€/l x 13 l/h = 6.50 €/h = 8 $/h Yearly savings = 6.5€ x 8000 h/y = 52,000 € per year = $ 64,000 per year* Calculation based on full load running for 8000 hours – full potential
Carbon Zero ZR range 10.4 bar(e) 151 psig ZR 55 – ZR 750 ZR 75 VSD – ZR 700 VSD 4 bar(e) 58 psig 270 m³/h 7,470 m³/h 159 cfm 4,387 cfm
Conclusions: Energy Efficiency in CAS Atlas Copco approach • Reducing air leaks • Ultrasonic leak detection • Overall system design • System audits and simulation • Optimal compression technologies • Control and ancillary systems • Use of adjustable speed drives (ASD) • Variable Speed Drives • Recovery of waste heat • Carbon Zero compressors recover up to 100%