Download

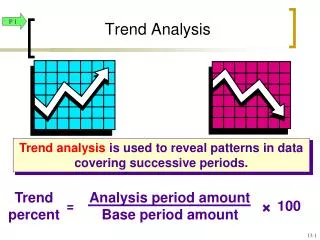
1 / 25
250 likes | 317 Views
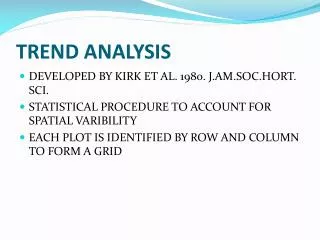
Socioeconomic Trend Analysis. Reno, NV February 2, 2007. Population Density. Source: Wikipedia Encyclopedia. Western States Population Density, 2000. Source: Wikipedia Encyclopedia. Nevada. Source: Bureau of Labor Statistics.

E N D
Socioeconomic Trend Analysis Reno, NV February 2, 2007
Population Density Source: Wikipedia Encyclopedia
Western States Population Density, 2000 Source: Wikipedia Encyclopedia
Nevada Source: Bureau of Labor Statistics
Nevada Metropolitan and Micropolitan Key Demographic Statistics, 2006 Source: U.S. Census Bureau
Outline • Why data is important in assessing a community? • What types of data are available and where to locate? • How can data be analyzed to better understand my community? • How can data and results be presented to targeted audiences? • Pacific Northwest Regional Economic Analysis Project
Why data is important in assessing my community?Why Social and Economic Data is Important • Data is powerful! • Can provide an excellent quantitative snapshot of a community • Single time period (2000 census) • Multiple time periods (1990 census and 2000 census) • Using both quantitative and qualitative data can better explain cause and effect relationships • Excellent educational tool for community leaders and broad community audiences
Types of Data AvailableTypes of Data • Primary Data • Collected at the source • Answers a research question • Examples – needs assessment, community and policy issues • Secondary Data • Collected and published by a third party • Provides a context for better understanding a community and issues
Types of Data AvailableLevels of Data • National • Regional • Multi-state • Multi-county • Local • County • City/Zip Code • Census tract
Types of Data Available Common Sources of Data • Federal • State • Local • Private
Types of Data Available Types of Data and Where to Locate • Demographic (basic social characteristics) • Employment (resident vs. commuter) • Occupation (employment & unemployment) • Income (payroll, transfer payments, etc..) • Trade (output, I-O, business characteristics)
Types of Data AvailableTypes of Data and Where to Locate (cont.) • Prices (cost of living, consumer expenditures) • Economic Assets (debt finance, research, education, infrastructure) • Quality of Life (housing, environ, etc…) • Industry (industrial sectors) • Firms (profit & nonprofit)
Using Data for AssessmentQuestions Often Asked • What does population tell us about our county/community? • What are the current employment conditions in our community? • What part of our local economy is growing or not growing? • How does our local economy compare to other nearby economies? • What are the current economic indicators for the community or region and how can this be used to identify opportunities?
Using Data for AssessmentKey Points to Consider when Conducting Demographic and Economic Analysis • No “single number” represents the local economy. • Make comparisons between other communities/counties. • Examine change over time. • A “reality check” is essential. Always be willing to use data that is provided by a reliable source.
Data & Analysis PresentationBasic Community/County Profile • Provides a basic overview of important demographic and economic indicators. • Data can be presented in a series of tables and/or charts. • Example – Lincoln County NevadaFact Sheet
Data & Analysis Presentation Basic Methods • Absolute Change (two or more points) • Percent Change (two or more points) • Index Change (comparison to a base year) • Percent Distribution
Data & Analysis PresentationData Presentation Examples Population (Absolute) Population (Index)
Data & Analysis PresentationEmployment Trends by Major Economic Sector
Data & Analysis PresentationData Presentation Examples Employment (% Change) Employment (Absolute)
Data & Analysis PresentationData Presentation Examples Employment 2000 Employment 1990