Download
1 / 27
270 likes | 277 Views
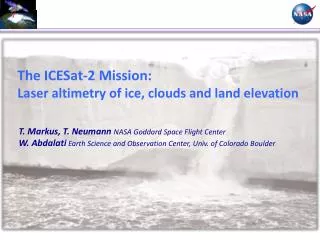
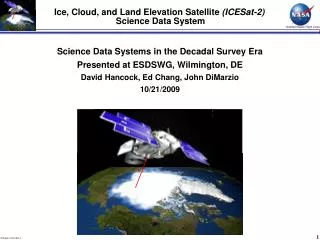
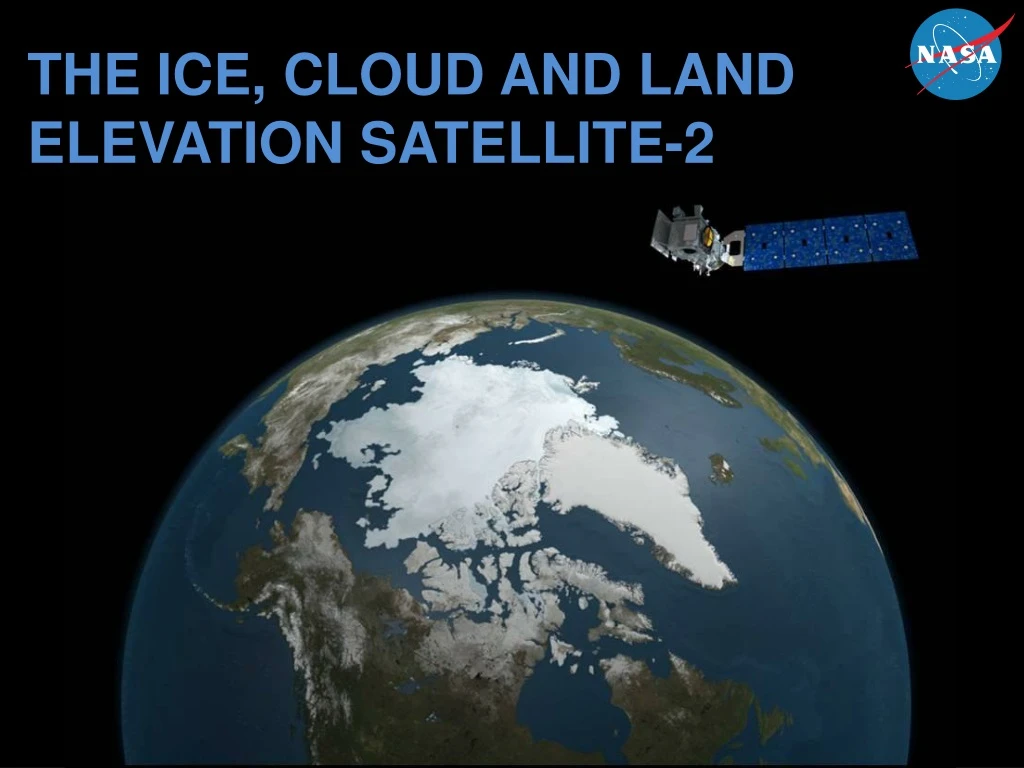
THE ICE, CLOUD AND LAND ELEVATION SATELLITE-2. What is ICESat-2?. ICESat-2 is the Ice, Cloud, and land Elevation Satellite-2. ICESat-2

E N D
What is ICESat-2? ICESat-2 is the Ice, Cloud, and land Elevation Satellite-2. ICESat-2 Slated for launch in 2017, ICESat-2 will continue the important observations of ice-sheet elevation change, sea-ice freeboard, and vegetation canopy height begun by ICESat in 2003. Together, these datasets will allow for continent-wide estimates in the change in volume of the Greenland and Antarctic ice sheets over a 15-year period, and long-term trend analysis of sea-ice thickness. Conceptual view of ICESat-2 in space
About ICESat ICESat was the benchmark Earth Observing System mission for measuring ice sheet mass balance, cloud and aerosol heights, as well as land topography and vegetation characteristics. From 2003 to 2009, the ICESat mission provided multi-year elevation data needed to determine ice sheet mass balance as well as cloud property information, especially for stratospheric clouds common over polar areas. It also provided topography and vegetation data around the globe, in addition to the polar-specific coverage over the Greenland and Antarctic ice sheets. Clouds and Aerosols over India Nadir View of Elevation Change in Greenland
Why Study Ice? What is ice?
Earth’s Poles Sea Ice= frozen sea water Ice Sheet= frozen land ice Arctic Sea Ice Antarctic Sea Ice Greenland Ice Sheet Antarctica Ice Sheet North Pole: Arctic South Pole: Antarctic
Antarctic Ice Versus Arctic Ice The Antarctic is land surrounded by sea ice and the Arctic is sea ice surrounded by land.
What studying ice sheets tells us Sea level is rising A 1-meter rise in sea level reclaims land, displacing populations and impacting economies around the globe. The red areas would be those affected (flooded) with a 1-meter rise in sea level.
Where are the ice sheets melting and why? Greenland The ice on the Greenland ice sheet is melting at an ever-increasing rate. Global temperatures are rising dramatically and the ice is feeling the warmth and melting July 8, 2012 July 12, 2012
Where are the ice sheets melting and why? Antarctica Changes in the ice mass of Antarctica, Earth's largest freshwater reservoir, are important to understanding global sea level rise. Large amounts of Antarctic freshwater flowing into the ocean also could affect ocean salinity, currents and global climate. Excessive ice melt
What accelerating glaciers mean! The retreat of the Jakobshavn Glacier, Greenland Retreating glaciers means there is an increase in ice loss. The increase in the speed of a glacier indicates an increase in ice loss. The faster the glacier is moving (retreating), the more ice will be lost in a short amount of time. May 9, 2014 June 1, 2014
What accelerating glaciers mean (cont.) Melting and Calving of the Pine Island Glacier, Antarctica The shelf of the Pine Island Glacier has been moving forward at a speed of 4km per year. This type of movement allows more land ice to fall into the ocean by breaking off Antarctica during a process called calving. 2005 2008 2013
Evidence from the ICESat Satellite and Operation IceBridge Aircraft The paths of the ICESat satellite are colored in gray and the tracks of the airborne mission Operation IceBridge are shown in purple. The satellite and airborne measurements show a drastic loss of Greenland ice sheet thickness from 2003-2012
Evidence from the GRACE Mission GRACE consists of two identical spacecraft that fly about 220 kilometers (137 miles) apart in a polar orbit 500 kilometers (310 miles) above Earth. GRACE maps Earth's gravity field by making accurate measurements of the distance between the two satellites, using GPS and a microwave ranging system. Monthly changes in Antarctic ice mass, in gigatons, as measured by NASA's Gravity Recovery and Climate Experiment (GRACE) satellites from 2003 to 2011
What studying ice sheets tells us A Warming Climate Temperature data from four international science institutions. All show rapid warming in the past few decades and that the last decade has been the warmest on record.
Arctic Sea Ice A Warming Climate Satellite-based passive microwave images of the sea ice have provided a reliable tool for continuously monitoring changes in the Arctic ice since 1979. Every summer the Arctic ice cap melts down to what scientists call its "minimum" before colder weather begins to cause ice cover to increase. The ice parameters derived from satellite ice concentration data that are most relevant to climate change studies are sea ice extent and sea ice area This graph displays the area of the minimum sea ice coverage each year from 1979 through 2013.
The Ice Albedo Effect Albedo is a measure of the reflectivity of the Earth's surface. Ice-albedo feedback is a strong positive feedback in the climate system. Warmer temperatures melt persistent ice masses in high elevations and upper latitudes. Ice reflects some of the solar energy back to space because it is highly reflective. If an equivalent area of ice is replaced by water or land, the lower albedo value reflects less and absorbs more energy, resulting in a warmer Earth.
What studying sea ice tells us Thermo-Haline Circulation The oceans are mostly composed of warm salty water near the surface over cold, less salty water in the ocean depths. These two regions don't mix except in certain special areas, which creates a large slow current called the thermohaline circulation. Surface Density colorbar. Colors range from lower densities (white) to higher densities (blue) to the highest densities (black).
Thermo-Haline Circulation The ocean is made of salt water, yet the sea ice on top of the Arctic ocean is fresh. Sea ice is fresh because sea ice expels salt into the water as it forms. When the sea ice moves south into the North Atlantic, it melts, creating a layer of fresh water over the ocean surface. This fresh water is less dense than salty water, so it tends to stay at the top of the ocean. This lower density discourages the normal process of sinking at high latitudes (poles) that supports thermohaline circulation, which makes it harder to move the warm water north from the equator.
What studying sea ice tells us Sea Ice Extent Time Series The concentrations are calculated for each ocean grid element and are used to derive ‘sea ice extent’, which is calculated as the sum of all ocean elements having a sea ice concentration of at least 15%, and ‘sea ice area’, which is calculated as the sum over all ocean grid elements of the product of ice concentration and grid element area.
What studying sea ice tells us Importance of Sea Ice Thickness • Sea ice reflects light from the Sun • When sea ice disappears, open water will absorb more summer heat. This will cause the sea ice to return more slowly each winter. • Increased sea ice melt changes the Arctic landscape, which is detrimental to living things that have adapted to the sea ice (ie. polar bears)
Measuring the height of the Earth’s canopy heights ICESat-2 will measure vegetation canopy height as a basis for estimating large-scale biomass and biomass change
Advancing laser altimetry technology from ICESat to ICESat-2 ICESat’s Geoscience Laser Altimeter System (GLAS) instrument Single laser 40 laser pulses per second ICESat-2’s Advanced Topographic Lidar Altimeter System (ATLAS) instrument Lasers split into 6 beams, arranged in 3 pairs 10,000 laser pulses per second
Advancing laser altimetry technology from ICESat to ICESat-2 (cont.) ICESat single laser beam ICESat-2 laser split into six beams, arranged in three pairs
Resources Official ICESat-2 Website - http://icesat.gsfc.nasa.gov/icesat2 Official ICESat Website - http://icesat.gsfc.nasa.gov/icesat/ Follow ICESat-2 on Facebook – https://www.facebook.com/ICESat2 ICESat-2 eClips Educator Videos - http://icesat.gsfc.nasa.gov/icesat2/media_videos.php Launching 2017