Download
1 / 15
160 likes | 454 Views
Design of W.W. Collection System. Design criteria: Waste water flow: Flow varies according to : The season (monthly variations) Weather conditions Week of the month , day of the week, time of the day. Estimation of the design flow Q des : Data needed:

E N D
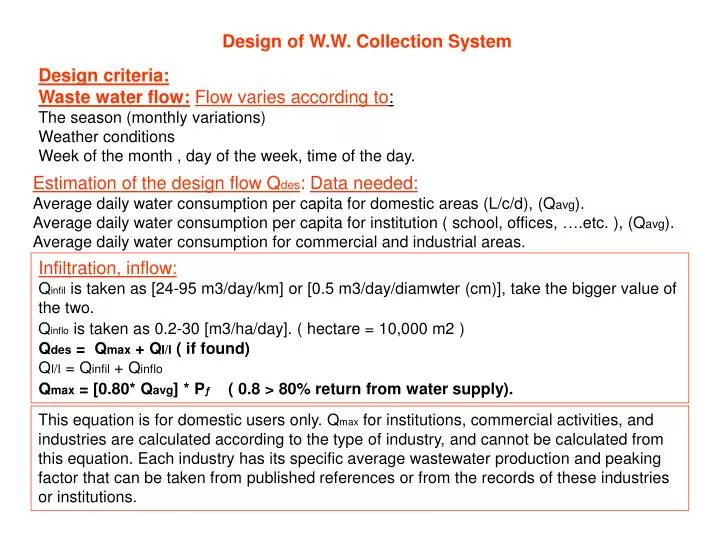
Design of W.W. Collection System Design criteria: Waste water flow:Flow varies according to: The season (monthly variations) Weather conditions Week of the month , day of the week, time of the day. Estimation of the design flow Qdes: Data needed: Average daily water consumption per capita for domestic areas (L/c/d), (Qavg). Average daily water consumption per capita for institution ( school, offices, ….etc. ), (Qavg). Average daily water consumption for commercial and industrial areas. Infiltration, inflow: Qinfil is taken as [24-95 m3/day/km] or [0.5 m3/day/diamwter (cm)], take the bigger value of the two. Qinflo is taken as 0.2-30 [m3/ha/day]. ( hectare = 10,000 m2) Qdes = Qmax + QI/I ( if found) QI/I = Qinfil + Qinflo Qmax = [0.80* Qavg] * Pƒ ( 0.8 > 80% return from water supply). This equation is for domestic users only. Qmax for institutions, commercial activities, and industries are calculated according to the type of industry, and cannot be calculated from this equation. Each industry has its specific average wastewater production and peaking factor that can be taken from published references or from the records of these industries or institutions.
Sewage flow diagram for a small town 1.8 1.5 1.0 0.5 0.0 149 86 43 Peak coefficient Average day flow Average 24 hr flow Flow coefficient Flow (L/s) Average night flow 0 2 4 6 8 10 12 14 16 18 20 22 24 hour
Note:[Qavg]w = 0.8 Qavg , which is the average domestic wastewater production , while Qavg is the average water consumption.
Example Solution
Maximum and minimum velocities: Minimum velocity of 0.6 m/s should be maintained to prevent solids settling, it is called self cleansing velocity. Maximum velocity should not be lighter than 3 m/s to prevent erosion of pipes and manholes. Minimum size of pipes: Minimum diameter is 8 inches (20 cm). Minimum Slope and maximum slope of sanitary sewers: Minimum slope is a function of the minimum velocity of 0.60 m/s (See the table). The maximum slope is related to the maximum velocity (3 m/s or any other velocity selected by the designer) according to the pipe material and the expected amount of sand carried with the wastewater. • Depth of excavation: • Minimum cover on the top of sewers • Depth of excavation depends on: • water table • topography • lowest point to be served • other factors
Manholes:Manholes are constructed in the following cases: • when pipes change in diameter • change of direction • change of slope • intersection of pipes • at interval, ( 20-100 m) • Lay-out plan • Find the intermediate points of collection from topographic maps. • Assign the final points of collection. • Draw lines indicating the flow of sewage by gravity (different alternatives). • The pipes can be considered as : • Building sewers. • Lateral sewers. • Sub main sewers. • Main sewers. • Trunk sewers. • Intercepting sewers. • The contributory area for each pipe is defined by drawing lines depending on topography and points of connection to manholes. • Manholes and pipes are given numbers to facilitate the design of each pipe.
Building sewer Main sewer Sub main sewer Lateral sewer Trunk sewer Intercepting sewer Outlet sewer Manholes Treatment Plant River
Sanitary Sewers Appurtenances • Manholes The following table gives the allowable intervals of manholes relative to the diameter: Note: The distance depends on the maintenance equipments available.
Manhole dimensions The diameter of the manhole or its side's dimensions depends on the depth of excavation. The following table gives their relation. • The cover of the manhole should be strong enough to withstand the loads of traffic. • It is usually made of cast iron to carry a minimum concentrated load of 25 ton. • The manhole should be supplied with steps to allow for maintenance access. • The floor of the manhole should be lined with cement mortar which is called benching.
Drop manhole:are used when the difference of elevation between the inlet pipe and the outlet pipe is ≥ 60cm. The drop manhole has a vertical pipe to prevent turbulence in the manhole and to allow the maintenance works to enter the manholes safely. Drop manhole Normal manhole Grease and oil traps: For the institutions, commercial units, restaurants and other places which produce oil and grease in there effluent, a grease and oil trap should be used to remove oil and grease before they enter the sewage pipes. Grease and oil affect the sewers and the treatment plant equipments that is why they should be removed. In case of the pipes, grease sticks to the walls and collects sand and other solids leading eventually to the decrease in the pipe diameter and some times to complete clogging. Grease and oil traps
Inverted siphon:When an obstacle such as railway or a river obstructs the sewer line the sewers can be lowered below these obstacles. • For the inverted siphon: Minimum velocity = 0.9 m/s • Pipes flow full (under pressure). • More than one pipe is used to overcome these variations. Usually Three pipes are used. • The first pipe is used to carry the minimum wastewater flow (Qmin), • The second carry the difference between the average flow and the minimum flow (Qavg-Qmin) • The third carries the difference between the average and the maximum flow (Qmax – Qavg) .