Download
1 / 3
30 likes | 121 Views
The Best Conditions for Life in a Pond. Casey Judge, Matthew Frykenberg, Seamus O'Shaughnessy University of Massachusetts Lowell TEAMS Academy – Environmental Biotechnology 2007. Introduction Our Goal was to study the: Affects of Different Samples of Water on life living in that water.

E N D
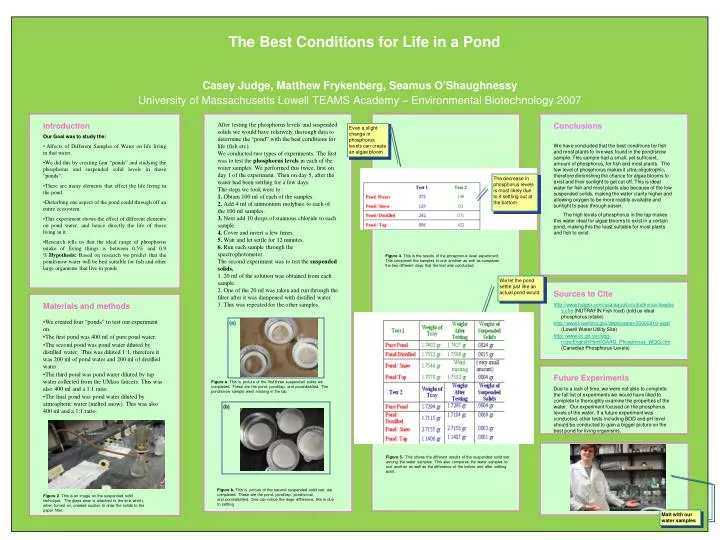
The Best Conditions for Life in a Pond Casey Judge, Matthew Frykenberg, Seamus O'ShaughnessyUniversity of Massachusetts Lowell TEAMS Academy – Environmental Biotechnology 2007 • Introduction • Our Goal was to study the: • Affects of Different Samples of Water on life living in that water. • We did this by creating four “ponds” and studying the phosphorus and suspended solid levels in those “ponds”. • There are many elements that effect the life living in the pond. • Disturbing one aspect of the pond could through off an entire ecosystem. • This experiment shows the effect of different elements on pond water, and hence directly the life of those living in it. • Research tells us that the ideal range of phosphorus intake of living things is between 0.5% and 0.9 %.Hypothesis: Based on research we predict that the pond/snow water will be best suitable for fish and other large organisms that live in ponds. After testing the phosphorus levels and suspended solids we would have relatively thorough data to determine the “pond” with the best conditions for life (fish etc). We conducted two types of experiments. The first was to test the phosphorus levels in each of the water samples. We performed this twice, first on day 1 of the experiment. Then on day 5, after the water had been settling for a few days. The steps we took were to : 1. Obtain 100 ml of each of the samples. 2. Add 4 ml of ammonium molybate to each of the 100 ml samples. 3. Next add 10 drops of stannous chloride to each sample. 4. Cover and invert a few times. 5. Wait and let settle for 12 minutes. 6. Run each sample through the spectrophotometer. The second experiment was to test the suspended solids. 1. 20 ml of the solution was obtained from each sample. 2. One of the 20 ml was taken and run through the filter after it was dampened with distilled water. 3. This was repeated for the other samples. Conclusions We have concluded that the best conditions for fish and most plants to live was found in the pond/snow sample. This sample had a small, yet sufficient, amount of phosphorus, for fish and most plants. The low level of phosphorus makes it ultra-oligotrophic, therefore diminishing the chance for algae blooms to exist and their sunlight to get cut off. This is ideal water for fish and most plants also because of the low suspended solids, making the water clarity higher and allowing oxygen to be more readily available and sunlight to pass through easier. The high levels of phosphorus in the tap makes this water ideal for algae blooms to exist in a certain pond, making this the least suitable for most plants and fish to exist. Even a slight change in phosphorus levels can create an algae bloom The decrease in phosphorus levels is most likely due to it settling out at the bottom Figure 4. This is the results of the phosphorus level experiment. This compared the samples to one another as well as compares the two different days that the test was conducted. We let the pond settle just like an actual pond would. Sources to Cite http://www.hagen.com/usa/aquatic/nutrafinmax/lowphos.cfm (NUTRAFIN Fish food) (told us ideal phosphorus intake) http://www.lowellma.gov/depts/water/20060619-wqdt (Lowell Water Utility Site) http://www.ec.gc.ca/ceqg-rcqe/English/Html/GAAG_Phosphorus_WQG.cfm (Canadian Phosphorus Levels) • Materials and methods • We created four “ponds” to test our experiment on. • The first pond was 400 ml of pure pond water. • The second pond was pond water diluted by distilled water. This was diluted 1:1, therefore it was 200 ml of pond water and 200 ml of distilled water. • The third pond was pond water diluted by tap water collected from the UMass faucets. This was also 400 ml and a 1:1 ratio. • The final pond was pond water diluted by atmospheric water (melted snow). This was also 400 ml and a 1:1 ratio. (a) Future Experiments Due to a lack of time, we were not able to complete the full list of experiments we would have liked to complete to thoroughly examine the properties of the water. Our experiment focused on the phosphorus levels of the water. If a future experiment was conducted, other tests including BOD and pH levelshould be conducted to gain a bigger picture on the best pond for living organisms. Figure a. This is picture of the first three suspended solids we completed. These are the pond, pond/tap, and pond/distilled. The pond/snow sample went missing in the lab. (b) Figure 5. This shows the different results of the suspended solid test among the water samples. This also compares the water samples to one another as well as the difference of the before and after settling point. Figure b. This is picture of the second suspended solid test we completed. These are the pond, pond/tap, pond/snow, and pond/distilled. One can notice the large difference, this is due to settling. Figure 2. This is an image on the suspended solid technique. The glass wear is attached to the sink which, when turned on, created suction to draw the solids to the paper filter. Matt with our water samples