Download
1 / 19
200 likes | 364 Views
Cause _effect. http://www.apriorit.com/our-articles/test-design-tips.html For more information. Objectives. Decision Table-Based Testing Cause-Effect Graphs in Functional testing Equivalence Partitioning and Boundary value Analysis State transition testing (revisited)

E N D
Cause _effect http://www.apriorit.com/our-articles/test-design-tips.html For more information
Objectives • Decision Table-Based Testing • Cause-Effect Graphs in Functional testing • Equivalence Partitioning and Boundary value Analysis • State transition testing (revisited) • Input validation and Syntax-driven Testing
Decision table-based Testing (DTT) • Applicable to the software requirements written using “if-then” statements • Can be automatically translated into code • Assume the independence of inputs • Example • If c1 AND c2 OR c3 then A1
Sample of Decision table • A decision table is consists of a number of columns (rules) that comprise all test situations • Action ai will take place if c1 and c2 are true
Example: Simple editor • A simple text editor should provide the following features • Copy • Paste • Boldface • Underline
Decision tables as a basis for test case design • The use of decision-table model to design test cases is applicable • The spec is given by table or is easily converted to one • The order in which the conditions are evaluated does not affect the interpretation of rules or the resulting action • The order in which the rules are evaluated does not affect the resulting action • Once a rule has been satisfied and an action is selected, no other rule need be examined • If multiple actions result from the satisfaction of a rule, the order in which the actions take place is not important
The implications of rules • The above conditions have the following implications • Rules are complete (i.e., every combination of decision table values including default combinations are inherent in the decision table) • The rules are consistent (i.e, there is not two actions for the same combinations of conditions)
Cause-effect graphs in black box testing • Captures the relationships between specific combinations of inputs (causes) and outputs (effects) • Deals with specific cases, • Avoids combinatorial explosion • Explore combinations of possible inputs • Causes/effects are represented as nodes of a cause effect graph • The graph also includes a number of intermediate nodes linking causes and effects
Drawing Cause-Effect Graphs A B If A then B (identity) A C B If (A and B)then C
Drawing Cause-Effect Graphs A C B If (A or B) then C A C B If (not(A and B)) then C
Drawing Cause-Effect Graphs A C B If (not (A or B))then C A B If (not A) then B
Constraint Symbols E: at most, one of a and b can be 1 a b a O O: Exactly one of A and B can be invoked b a I: at least one of a or b must be 1 b
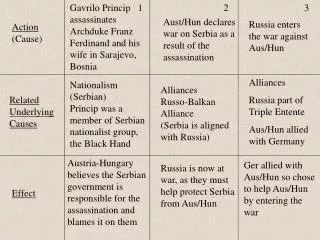
Example: ATM • For a simple ATM banking transaction system • Causes (inputs) • C1: Command is credit • C2: command is debit • C3: account number is valid • C4: transaction amount is valid • Effects • E1: Print “invalid command” • E2: Print “ invalid account number” • E3: Print “debit amount not valid” • E4: debit account • E5: Credit account
E1 or C1 and E2 C2 and E3 C3 and E4 C4 E5 and
Description of processing nodes used in a Cause-effect graph ()
ATM Cause-effect decision table Don’t Care condition
Steps to create cause-effect graph • Study the functional requirements and divide the requirements into workable pieces • E.g. of workable piece, in eCom, can be verifying a single item placed in shopping cart • Identify causes and effects in the specifications • Causes: distinct input conditions • Effects: an output condition or a system transformations. • Assign unique number to each cause and effect • Use the semantic content of the spec and transform it into a Boolean graph • Annotate the graph with constrains describing combinations of causes and/or effects • Convert the graph into a limited-entry decision table • Use each column as a test case
Possible research topics based on CEG • Comparison of CEG ,FSM-based test sets, and randomly generated test cases (functional) • For effectiveness in terms of cost and fault detection capabilities • For fault detection capabilities • For number of test cases generated (cost) • For automatic generation of actual test cases