Download
1 / 7
70 likes | 212 Views
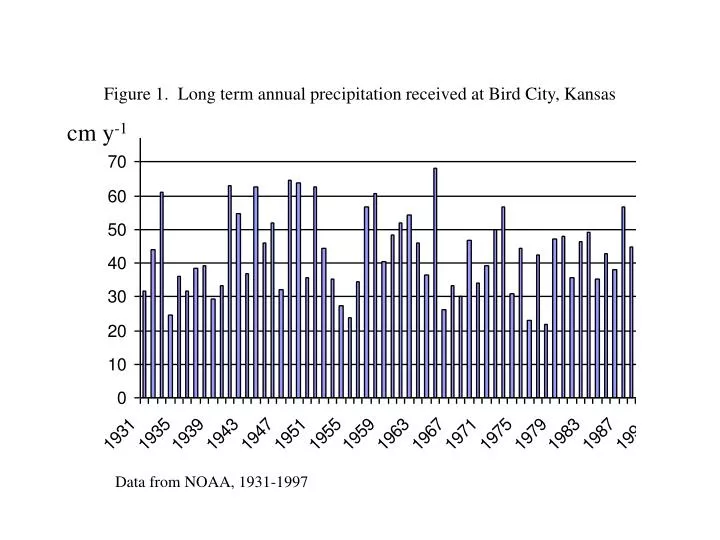
Figure 1. Long term annual precipitation received at Bird City, Kansas. cm y -1. Data from NOAA, 1931-1997. Figure 2. Precipitation distribution patterns across Kansas. 78.7. 44.2. 64.3. 102.1. 48.8. Data from NOAA, 1931-1997. Note: values are average year precipitation in cm .

E N D
Figure 1. Long term annual precipitation received at Bird City, Kansas cm y-1 Data from NOAA, 1931-1997
Figure 2. Precipitation distribution patterns across Kansas 78.7 44.2 64.3 102.1 48.8 Data from NOAA, 1931-1997 Note: values are average year precipitation in cm
Figure 3. Effect of surface residue and water quality on infiltration rates Soil Sci Soc Am J 62:1377-1383
Figure 4. Ratio of grain yields for 150% residue versus 100% residue across years for nitrogen by tillage by cover crop study. Power et al., 1998
Figure 5. Stability indices of aggregates in conventional and no-tillage systems for two soil sampling depths. 0 to 5 cm depth 5 to 15 cm depth SSSAJ 58:777-786 (1994)
Figure 6. Carbon dioxide evolution from aggregates in different tillage systems. > 2000 um aggregates 250 to 2000 um aggregates SSSAJ 58:787-795 (1994)
Table 1. Effect of tillage, fertilizer, and cover crop on yield of corn following a long-term no-tillage study where different amounts of residue were returned to plots following harvest. Notes: Fertilized with 0 or 67 kg ha-1 ammonium nitrate Cover crop: hairy vetch overseeded in early September tillage: none or disk Power et al., 1998