Download
1 / 26
270 likes | 475 Views
Population Maps of Latin America Glenn Hyman, Andy Nelson, German Lema International Center for Tropical Agriculture Cali, Colombia. Outline Why we need population maps The Database Gridding methods Verification

E N D
Population Maps of Latin America Glenn Hyman, Andy Nelson, German Lema International Center for Tropical Agriculture Cali, Colombia
Outline • Why we need population maps • The Database • Gridding methods • Verification • Relationships between population and other variables • Future Research
Potential Agricultural Productivity Population summed by zones Note: Areas en black are cities. Zones in Purple are higher rural population densities. Zones in green are low rural population densities. Raster Population Surface
CIAT Administrative Division Database 10,400 units most are municipios Municipio level Parroquia level
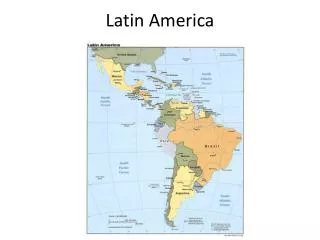
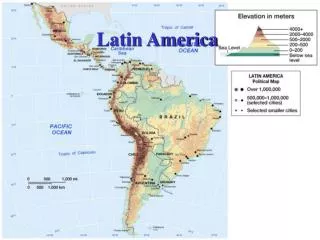
Population Density in Latin America and the Caribbean people/km2 < 1 1-10 10-25 25-50 50-100 >100 Source:CIAT’s Population Database
Growth rates were calculated from ECLAC’s population • database at the department level • An exponential growth rate function was used • Population was estimated to the year 2000 • We used figures from the last 2 population censuses at • department level to calculate population growth rates r = ( ln ( pf / pi ) ) / t where: r = rate ln= logaritmo natural pf = population at final time pi = population at initial time t = period of time
Gridding Methods • Equal distribution • (total population / number of cells in unit) • Pycnophylactic • Accessibility • Weight model
Caminos y Rios Roads and Rivers from DCW Pendientes Slope from 1 km DEM Luces Nocturnas Nighttime Lights
Continental Scale Accessibility Mapping Model based on travel time to populated places Model uses roads, rivers, populated places, slope, and land cover to estimate travel time
Population from Census Accessibility Model
Municipio Distrito Ecuador 203 976 Peru 191 1836
Verification data from different scales and independently collected Model where municipal level data is verified from data aggregated to finer district level
Modeled population counts compared to census data for Peru and Ecuador verification data sets: percentage differences PERU Variable N Mean Minimum Maximum CV Sum ------------------------------------------------------------------------ DAREA 1781 196.40 0.13 16741.92 371.72 349797.39 DPYCNO 1781 190.89 0.17 20361.68 378.29 339991.89 DACCESS 1781 168.63 0.04 17139.46 381.31 300337.16 DACCESS_2 1781 160.16 0.02 15857.71 352.97 285248.06 DWEIGHT 1781 148.56 0.02 11166.89 338.47 264588.71 ECUADOR Variable N Mean Minimum Maximum CV Sum ---------------------------------------------------------------------- DAREA 918 235.06 0.01 17803.46 354.12 215788.54 DPYCNO 918 235.38 0.20 16337.44 342.67 216080.66 DACCESS 918 176.95 0.12 5001.63 248.19 162441.51 DACCESS_2 918 178.11 0.22 4116.35 233.95 163508.02 DWEIGHT 918 154.62 0.59 5022.37 235.05 141944.20
Ecuador BEST Frequency Percent ----------------------------- area 150 16.5 access 154 16.9 access_2 168 18.5 pycno 183 20.1 weight 255 28.0 Peru BEST Frequency Percent ----------------------------- area 265 15.0 access 320 18.1 access_2 404 22.8 pycno 291 16.4 weight 492 27.8
Relationships between population and other variables
0-1 1-10 10-20 20-30 30-40 40-50 50-60 60-70 70-80 80-90 90-100 >100 No Data Distribution of Rural Population in Latin America and the Caribbean People per km2 Central America, the Andes, and the Caribbean have the highest rural population densities. Source: CEPAL
Rural Model Variable R2 Cumulative R2 URBANO 0.52 0.52 AGUA 0.23 0.75 PEN25_50 0.06 0.81 Variable Parameter F Prob > F Estimate AGUA 441.14117780 346.35 0.0001 URBANO 4373.57019841 774.39 0.0001 PEN25_50 110.28701024 111.94 0.0001
Urban Model Variable R2 Cumulative R2 URBANO 0.7548 0.7548 LUC100 0.0376 0.7924 LUC25 0.0146 0.8069 AGUA 0.0133 0.8202 Variable Parameter F Prob>F Estimate URBANO 36362.6 694.94 0.0001 LUC100 2564.6 80.49 0.0001 LUC25 -2558.5 34.26 0.0001 AGUA 873.8 23.48 0.0001
Future Work • Gridding using statistical results • Further verification using data from Peru, Honduras and Ecuador • Compare to other work (eg. ORNL 1 km • database) • A Rural population map? • New Map with 2000 Census round focusing on • Amazon basin, Central American hillsides, Latin American savanas.