Download
1 / 9
90 likes | 218 Views
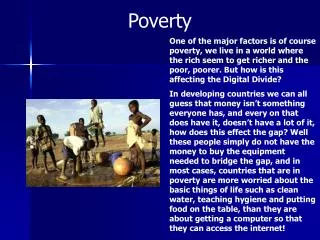
Poverty Mapping. Malnutrition in Nigeria • Top-10 of countries with children <5yrs either - underweight, - stunted - wasted children • <5yrs mortality rate - 191 per 1000 births (SOFI 2001, 1995 figures). Malnutrition in Nigeria. 1. Decision Making Problems

E N D
Malnutrition in Nigeria • •Top-10 of countries with children <5yrs either • - underweight, • - stunted • - wasted children • • <5yrs mortality rate • - 191 per 1000 births • (SOFI 2001, 1995 figures) Malnutrition in Nigeria • 1. Decision Making Problems • 2. Gather Data and Build a GIS • 3. Conduct Spatial Analysis • 4. Generate Maps, Products • 5. Disseminate to Users • 1. what is the end-objective? • Increased Nutrition • 2. what is the best intervention level? • 3. How to achieve this intervention? • 4. How to reach target group? • Undernourishment in Nigeria • 1980 44% • 1991 16% • 1997 8% • (SOFI, 2000)
Malnutrition in Nigeria Intervention Pathways • 1. what is the end-objective? • Increased Nutrition • 2. what is the best intervention level? • 3. How to achieve this intervention? • 4. How to reach target group?
1. What is the end-objective? • 2. What is the best intervention level? • - Food Survey Sampling: 3 states per AEZ; 10 LGA per State, 10 Villages per LGA, 2-4 HH per village - Nutrition Study: Within-state Grid-based sampling • - Intervention possibilities: Intervention Level • 3. How to achieve this intervention? • 4. How to reach target group? Malnutrition in Nigeria “Use of geospatial predictive drivers” Regional Organisations and Institutions Scaling UP National Government, Organisations and Institutions Catalysts IITA NARES NGOs Innovative Farmers Local Government, Org. andInstitutions Household Village Community
Malnutrition in Nigeria Scale-Dependent Framework Intervention, Catalysts CGIAR NARES NGOs Innovative Farmers • 2. What is the best intervention level? • 3. How to achieve this intervention? • 4. How to reach target group? Note: CBO is community-based organisation. Source: Douthwaite/Van Der Meer after Ellis-Jones (2001) adapted from IIRR (2000)
Malnutrition in Nigeria “Use of geospatial predictive drivers” G I S Intervention IITA NARS NGO Innovative Farmers Information Analysis Present G I S • 1. What is the end-objective? • 2. What is the best intervention level? • 3. How to achieve this intervention? • - Use of GIS in defining problem (Information), • (Spatial) Awareness/ Analysis, Communication to Policy Makers • 4. How to reach target group?
Malnutrition in Nigeria “What Researchers Will Do” • 1. Decision Making Problems • 2. Gather Data and Build a GIS • 3. Conduct Spatial Analysis • 4. Generate Maps, Products • 5. Disseminate to Users
Malnutrition in Nigeria Proposal • 1. Decision Making Problems • 2. Gather Data and Build a GIS • 3. Conduct Spatial Analysis • 4. Generate Maps, Products • 5. Disseminate to Users • • - Surveys • … - General • … • • RUSEP