Download
1 / 57
650 likes | 869 Views
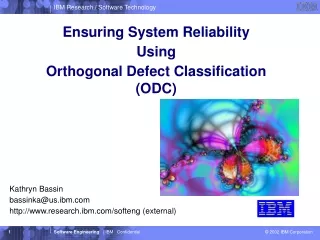
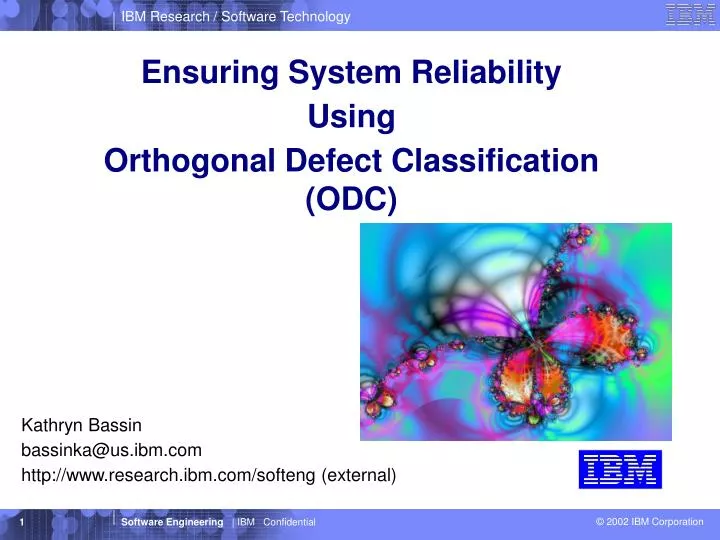
Ensuring System Reliability Using Orthogonal Defect Classification (ODC). Kathryn Bassin bassinka@us.ibm.com http://www.research.ibm.com/softeng (external). Agenda. Let’s talk about “Reliability”…. History and Overview of ODC and the Butterfly Model Focus of analysis

E N D
Ensuring System Reliability Using Orthogonal Defect Classification (ODC) Kathryn Bassin bassinka@us.ibm.com http://www.research.ibm.com/softeng (external)
Agenda • Let’s talk about “Reliability”…. • History and Overview of ODC and the Butterfly Model • Focus of analysis • Analyzing the past track record and setting an expectation • Identifying focus areas based on history • The customer’s perspective • The “in-process” perspective • Quantifying the planned process and effort • Improved Entrance & Exit Criteria • Tracking, evaluation, and risk assessment during the project • Evaluate system/product/component stability • Assess process effectiveness • Comprehensiveness and effectiveness of defect removal • Preventing defect injection • Quantify and manage risk • Beyond ODC - How do we analyze other aspects of quality and reliability?
What is “software reliability”? According to Wikepedia… Software Quality When applied to software the adjective quality may apply to source code as seen by software developers, or to applications software as seen by the end-users of the software. There are many attributes that can be used to measure software quality. The definition of quality as fitness for purpose means that the purpose of the software needs to be used to deduce those attributes that should be used to measure its quality. One attribute often used is the number of faults encountered in the software. Software that contains few faults is considered to have higher quality than software that contains many faults. For the purposes of today’s talk, I will be describing how ODC (Orthogonal Defect Classification) provides the method and mechanisms for defining, measuring, analyzing, and improving the reliability of systems, products, or components based primarily on studying its acknowledged and documented faults, across many dimensions.
If you are documenting defects, you are already classifying them.. • Open Date • Closed Date • Severity • Priority • Failing Component • Opener • Closer • Status • Resolution • Phase found • (Phase injected) • …….. These fields are used to manage and prioritize defects, but when combined with ODC, they become much more powerful! ODC provides semantic, non redundant information about the defects, enabling them to be associated with the processes used to design, develop, and test the software – then using the same taxonomy to define, unobtrusively, a “customer usage” profile.
Orthogonal Defect Classification (ODC) Classifying by Attributes Tracking Activity/Trigger Impact Customer View How defect detected Feedback on Verification Process Open Fix Interaction Close Feedback on Development Process Priority Etc. Source Where defect located Target/Type What was fixed Qualifier Missing, Incorrect, Extraneous? Age History • Multi-dimensional semantic data relating cause and effect • Uniform across development • Consistent across products, labs, etc.
Defect Measurement & Analysis Statistical Causal Defect Analysis Models Counting techniques, Investigates the details comparison to historical data, of a few defects ODC growth curve modeling (Orthogonal Defect Classification) Time consuming Not easily translatable into and expensive corrective actions. captures semantics of each defect and links their distribution to the progress and maturity of the product
Hindsight analysis of the development defects in a component of a high-end operating system- approximately 70 kloc Period 0 Period 1 Period 3 Period 2
Defect Prevention Opportunity ODC Defect Types Mapped to Generic Activity Injecting Defects High Level Requirements Missing Function/Class Missing Interface/Messages Missing Timing/Serialization Missing Relationship High Level Design Incorrect Function/Class Incorrect Interface/Messages Incorrect Timing Serialization Incorrect Relationship Low Level Requirements Missing Algorithm/Method Incorrect Algorithm/Method Missing Checking Low Level Design Missing Assignment Incorrect Assignment Incorrect Checking Code
Sample Trigger-Trigger Relationships to Illustrate escapes Design Review Design Conf. Logic/ Data Flow Backward Comp. Lateral Comp. Concurr. Language Dependency Internal Doc. Side Effect Rare Sit. Code Inspection Simple Path Complex Path Unit Test Coverage Variation Sequencing Interaction FVT Blocked Test StartUp/ Restart Hardware Config Software Config Recovery Path Workload/ Stress SVT
Product A- Release 2: In-process defects Activity by ODC Triggers • Code size 1.4 Mloc • Base Inspection is the lowest investment • Distribution very different from customer usage • High volume of test coverage and normal mode indicate incomplete or ineffective inspections
Product A- Release 6: In-process defects Activity by ODC Triggers • Code size 4.1 Mloc • Similar new development but a lot less defects (notice scale) • Early investment targeting customer usage profile and early discovery • Profiles very close to customer usage (verified by chi-square test) • less test coverage and less normal mode
Product A- Release 2: Field defects ODC Triggers • Field volumes are 75% of the in-process volume and they are both high. • Many field escapes related to inspection • Customer usage exposures should be mapped to skills (e.g. backward compatibility) • Was there opportunity to test adequately, given removal of basic problems • Customer usage indicates where test plans should be focused
Product A- Release 6: Field defects by ODC Triggers • Field volumes are 25% of in-process volumes and both are low.
Review/Inspection Triggers by (minimum) Experience Inspector's Experience Triggers New/ Trained Within Project Within Product Cross Product Solution (Cross Platform) Design Conformance x x Understanding Flow x x Internal Document consistency/completeness x Backward Compatibility x Lateral Compatibility x x Concurrency x x Language Dependency x Side Effects x x x Rare Situations x x x
Function Test Triggers by (minimum) Experience Tester's Experience Triggers New/ Trained Within Project Within Product Cross Product Solution (Cross Platform) White Box Simple Path Coverage x x Complex Path Coverage x x Side Effects x x x Black Box Single-function coverage x x Single-function variation x x x Multi-function sequencing x x x Multi-function interaction x x x
System Test Triggers by (minimum) Experience Tester's Experience Triggers New/ Trained Within Project Within Product Cross Product Solution (Cross Platform) Software Configuration x x x Hardware Configuration x x x Interproduct Interaction x x Startup/Restart x x x x Recovery Path x x x x Workload/Stress x x x
Product "J" In-Process Discoveries Defect Type (2101 valid PTMs)
Product "J" Field Discoveries Defect Type (384 APARs)
ODC Advantages Scientific management of software development and service • ODC/Butterfly model provides: • a mechanism for tracking progress and performing risk analysis during all defect removal activities (reviews, inspections, testing) • a method of evaluating the effectiveness and comprehensiveness of the processes planned and executed (i.e. signatures) • a profile of the system/product/application • a profile of customer usage • an accurate projection of volume, distribution, and periodicity of defects • a consistent & effective way to deal with issues related to In-process development and post-production escapes • inexpensive, effective feedback across all activities related to software life cycle
Situation Customer Activity Problem Category Resolution (Problem) Target, Qualifier Preventive Target, Qualifier Resolution Time Improvement, Qualifier Target Product, Component, Area Integration Level E-Support Questions, Tech-notes Globalization/Localization (Defect Removal) Activity Trigger Impact (Defect) Target Defect Type, Qualifier Source Age Analysis of Problems and Defects
OPC: Changes in the SW Lifecycle Before OPC Analysis, Architecture, And Design Construction Testing Service Isolation from NDOPs solution problem
OPC: Changes in the SW Lifecycle After OPC Problem Prevention Actions Analysis, Architecture, And Design Construction Testing Service solution problem