Download
1 / 66
670 likes | 778 Views
Detection of Anthropogenic Signals that are Below Thermal Noise Power. Roger De Roo IEEE SEM Fall Conference 2012 Nov 14. Outline. Motivation Physics of passive remote sensing Monitoring the soil moisture with microwave radiometry Radio Frequency Interference: a major problem

E N D
Detection of Anthropogenic Signals that are Below Thermal Noise Power Roger De Roo IEEE SEM Fall Conference 2012 Nov 14
Outline • Motivation • Physics of passive remote sensing • Monitoring the soil moisture with microwave radiometry • Radio Frequency Interference: a major problem • Summary of RFI detection approaches • Kurtosis algorithm development • Conclusions • Thanks to: Chris Ruf, U-M; Joel Johnson, OSU; Jeff Piepmeier, NASA Goddard; Sid Misra, JPL
Soil Moisture: who cares? • Soil Moisture regulates plant transpiration • Transpiration determines humidity • Humidity gives rise to clouds • No widespread measurements of soil moisture currently
Tx Rx Rx What’s so great about Microwave Remote Sensing? Long wavelengths (3mm to 30cm) don’t scatter off of objects the size of cloud droplets -- microwaves see through clouds Radar (“Active”) Radiometry (“Passive”) • Very high spatial resolution • Power hungry: expensive • Sensitive to geometry of water: eg. Movement of trees causes big signal changes • Poor spatial resolution • Low power requirements • Insensitive to geometry of water
Planck Blackbody Radiation 6000K white hot the Sun 3000K red hot 300K room temp 30K 3K outer space 1 GHz 1 THz 1 PHz frequency wavelength 0.3 m 0.3 mm 0.3 um
Microwave Characteristics of the Atmosphere from LeVine, Wilheit, Murphy and Swift, 1989
Products by frequency Also: -Sea surface salinity at 1.4GHz -Vegetation moisture content at 1.4 and 6 GHz -Vegetation temperature at 18 – 90 GHz from LeVine, Wilheit, Murphy and Swift, 1989
Microwave Brightness and Moisture • Water molecules have large electric dipole, unlike rest of nature Liquid water molecules will orient itself with passing electromagnetic waves, slowing the wave down The molecule can keep up with the wave until 9 GHz (index of refraction: n = 9 at 1GHz, but n = 2 at 100 GHz) H - O + H ε' = n2
Space 2.7K Space 2.7K Sensor Sensor Dry Soil ~300K Wet Soil ~300K Microwave Brightness and Moisture • An interface w/ high contrast of index of refraction leads to reflection • Dry soils appear warm, while wet soils appear cold, at the same temp. Transparent Atmosphere Transparent Atmosphere High Contrast at Interface Low Contrast at Interface
4.0 BARE 0 3.0 1 VEGETATION Sensitivity D TB / D VSM (K/%) WATER CONTENT 2 (kg/m2) 2.0 4 1.0 0.0 0 5 10 15 20 25 Wavelength (cm) SSM/I AMSR SMAP Sensitivity of Radiobrightness to Soil Moisture Under a Vegetation Canopy 19 GHz 6.9 GHz 1.4 GHz Courtesy of P. O’Neill
University of Michigan Radiometers L-band 1.4 GHz l = 21 cm satellites: SMOS Nov ‘09 Aquarius Jun ‘11 SMAP ‘14 C-band 6.7 GHz l = 4.5 cm satellites: AMSR-E ’02-’11 19 GHz 37 GHz l = 1.6 cm l = 0.8 cm satellites: SSM/I etc. ‘87 to present Antenna size is proportional to wavelength
Trouble with the 1.4GHz Radiometer Both of these ranges appear plausible
Potentially Interfering Radars:Cobra Dane Peak Transmit Power 16.8 MW Transmit Frequency 1.215-1.375GHz Raytheon
Surrounded by Interfering Radars? FPS-124 FPS-108 Cobra Dane Observation site: Toolik Lake FPS-117 ITT, ‘05
AMSR-E Interference at 6.9GHz If it is not purple, we cannot use the data from that location If it is purple, the data from that location might be OK…or not Li et al., ’04
Traditional Radiometer Technology • Use square law detector for signal power v k1v2
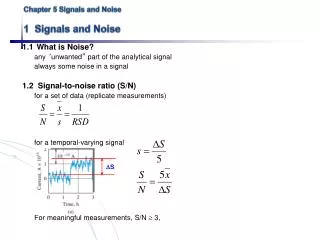
Effect of Finite Samples: RFI-free signals • Variance of voltage waveform contains brightness power: PIF = kBTSYSB G = <v2(t)>/Z TSYS = TB + TREC • Finite number of samples results in a measurement variance: σ = NEΔT = TSYS / √N N=Bτ • RFI always biases measurements of TB upwards • Averaging preserves the bias – thus, not a solution • We’d like to see RFI at near the NEΔT power level
Approaches to Detecting RFI • Time domain – look for pulses • Frequency domain – look for carrier frequencies • Amplitude domain – look for non-thermal distribution Gaussian pdf Sinusoidal waveform Non-Gaussian pdf Thermal waveform
Digital Radiometry Digital radiometers use fast analog-to-digital converters to measure the voltage waveform Power is determined by finding the variance (2nd moment) of the quantized data Processing capability allows for implementation of one or more RFI mitigation strategies
Literature Search • What has already been done on this problem, or related problems? • For RFI mitigation, nothing in the amplitude domain. Some in time-domain and some in frequency domain. • However, testing for normality of a distribution does have a rich literature. Lotsa ways to do it, and it is known how well they work.
Is it Normal? Statistical moments: • 0th… event count • 1st… Mean • 2nd …Variance • 3rd … Skew • 4th … Kurtosis
Skew • Measures how asymmetric a distribution is • Normal distribution has zero skew • So does RFI
Sources of Skew • No skew for • pulsed sinusoid (ps), • Amplitude Modulation (AM), or • Frequency Modulation (FM) • Skew possible, but unlikely, with Phase Modulation (PM) AM FM PM
Kurtosis • Kurtosis measure “peakedness” of a distribution • Normal distribution has kurtosis = 3 • RFI can have any kurtosis
Definition of Kurtosis • Desired radiometric (science) signals generated by thermal noise • Gaussian (bell-curve) probability distribution function (PDF) • RFI is man-made • PDFs will be non-Gaussian in general • Underlying Statistics • all higher-order moments of a Gaussian are uniquely determined by its lowest two moments • for example, the kurtosis equals 3 for a Gaussian v(t) • where v(t) is the zero-mean pre-detected radiometer output voltage
Technology Approach • Digitized IF waveforms lend themselves to moment estimation • Use moment ratios to test for presence of RFI • 1st moment, 1, is a DC offset • 2nd central moment, m2, is power – the measurement objective • Odd central moments are all zero • The lowest moment for RFI detection is the 4th central moment m4 ADC vi FPGA
Alternative Technology Approach(explored by Jeff Piepmeier of NASA) • Use square law detector for signal power • (traditional radiometer architecture) • Use a second square law detector for the 4th moment v k1v2 k2v4
Probability Densities of signals w/ & w/o RFI Expected PDF of thermal noise with variance σ2with pulsed sinusoidal RFI of amplitude A and duty cycle d: (extension of Rice, 1948) = Noise w/ constant power, σ2 RFI w/ Constant Amplitude, A Varying duty cycle, d
All curves have the same variance: A radiometer will report all of these signals as the same brightness Pulsed sinusoid to noise ratio: S = dA2/2σ2
Effect of Finite Samples: RFI-free signals • Exact kurtosis pdf unknown • Kurtosis pdf is skewed • less so as N∞ • kurtosis pdf is essentially Gaussian N>50k • Mean of R=3(N-1)/(N+1) • Variance of R 24/N as N∞
FAR PD Rth,a Detection Concepts
False Alarm Rate and Probability of Detection of Pulsed Sinusoidal RFI • For RFI power level at brightness temperature equivalent to 2NEDT, detection threshold can be set to give: • 90% probability of detection • 3% false alarm rate • 0.1% duty cycle case corresponds to ARSR-1 operating mode • Higher duty cycle reduces detectability
Minimum detectable RFI d is radar duty cycle PD=1-FAR z is a FAR parameter z=3 FAR=0.25% z=2 FAR= 5% z=1 FAR=30% For large N, min detectable RFI TPS ~ N-¼ NEDT ~ N-½
“Blind Spot” at 50% duty cycle, and solution CFAR R4 (kurtosis) 13% blind spot 50% blind spot 61% blind spot CFAR R6 R6= -0.085 R6=+0.085 R6=+0.085 N=100kSa Threshold at 1σ (30% FAR) R4=-0.0155 R4=+0.0155
Laboratory Experiments • Check assumptions about radiometer operation • RFI is prescribed to conform to our theory’s assumptions
Laboratory Experiment Results • Kurtosis R= m4/m22 • In the absence of RFI, R=3 • For CW RFI (eg. Carriers) R<3 • For short duty cycle RFI (eg. RADAR), R>3 • But R=3 also for 50% duty cycle
Kurtosis of RFI free signals • Kurtosis False Alarm Rate confirmed with simulations • PALS-ADD data: a minute of apparently RFI free data • RFI free assumption supported by kurtosis FAR predictions Theoretical FAR=1-erf( z /√2) RFI flags from clean PALS-ADD data z = |Rth-3| / σR0
Kurtosis of the RFI-free: digitization effects • Effects considered (and are very small): • Kurtosis pdf itself is Gaussian for 50k+ independent samples • Clipping of signals by finite Analog to Digital Converter (ADC) dynamic range: 4 bits is enough; 3 bits, maybe • Digitization (ADC bin size) effects are negligible. • ADC null offsets can be corrected with 1st and 3rd moments in addition to 2nd and 4th moments needed for kurtosis algorithm. • Effects not yet considered: • Integral Nonlinearity and Differential Nonlinearity of Analog to Digital Converters: likely is small effect because Flash ADC typically have small INL and DNL • Correlated data: we are still applying the theoretical tools to analyze the effects of sampling above the Nyquist rate on the kurtosis calculation.
Kurtosis of RFI-free: effects of digitization • Digitization reduces kurtosis • Bin size effects decrease as noise amplitude increases • Threshold locations not critical for s>3/4 • Saturation of ADC at high noise amplitude distorts kurtosis Number of ADC bins s = 3/4
Field Experiments • A lot of fun to do! • Takes lots of people ($$$) to do.
Example of RFI detection with Kurtosis (1) • 1 minute of data from ADD back-end attached to PALS front-end at JPL • Antenna looking to sky • Kurtosis thresholds set to trigger 1 false alarm per minute • Flagged observations: some obvious RFI, some not RFI flags TSYS (counts2) seconds
Example of RFI detection with Kurtosis (2) • Another PALS minute of data; same kurtosis thresholds • Antenna looking to sky; absorber placed over antenna • Changes in brightness do not get flagged RFI flags TSYS (counts2) sky sky absorber seconds
Soil Moisture: Active and Passive (SMAP) NASA environmental satellite Currently in planning stages Launch Nov 2014 Kurtosis is the main RFI detection algorithm
Conclusions • Theoretical behavior of the kurtosis statistic as a detector of pulsed sinusoidal RFI has been explored. • Kurtosis has a blind spot at 50% duty cycle sinusoids • CW RFI lowers kurtosis below 3 • Low duty cycle sinusoidal pulses raise the kurtosis above 3 • Kurtosis is very sensitive to low duty cycle sinusoid pulses • Kurtosis is minimally affected by digital receiver properties • False Alarm Rate of kurtosis algorithm is confirmed • Minimum detectable RFI is comparable to NEDT in realistic circumstances, may be less than NEDT • Kurtosis false alarms do not bias the estimate of the brightness • The kurtosis does not flag gradual changes in brightness.


![Thermal Noise No = k x T No : noise power density [watt/Hz]](https://cdn1.slideserve.com/3282731/slide1-dt.jpg)