Download

1 / 25
250 likes | 385 Views
Human Population. Demography. Trends in Population. Demography is the study of human populations.

E N D
Human Population Demography
Trends in Population • Demography is the study of human populations. • This study is an important tool for government and business because it helps predict future needs for schools, housing, and labour, formulate plans to deal with any changes, and to determine what types of consumer goods and services will be needed.
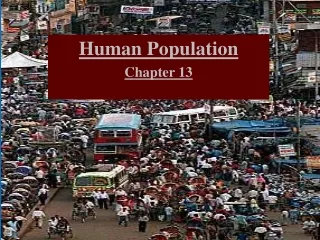
Approximately 90% of the human population lives on 20% of the Earth’s land area.
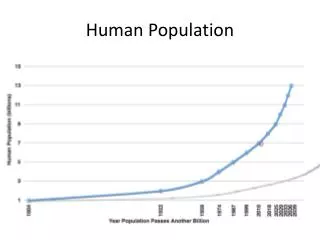
The Population Explosion • In 1960, the world’s population had reached 3 billion. It had taken more than 1 million years to reach this level. • By 1999, fewer than 40 years later, the population had doubled to 6 billion.
Declining Growth Rate • At first glance, the decline in the world’s growth rate since 1980 seems insignificant. It has dropped from 2.31% in 1980 to 1.25% in 2007. • Historically, a rate of 1.25% would be a high rate of growth, but the drop from 2.31 to 1.25 represents the largest decline in the world’s population growth rate in human history.
How Does This Affect You? • If Canada’s population growth rate keeps declining… • More people will be retiring than are entering the workforce. You will have to pay higher taxes to cover the cost of services needed by the aging population (pensions, health care, retirement homes). • The housing market will begin to falter as the demand for homes decreases. House values decrease as the market slows, giving you less return on your housing investment.
Technological Change and Population Growth • At different times in human history, revolutionary discoveries in technology have produced changes in the way people live and the carrying capacity of the Earth.
Stage 1: Hunting and Gathering • In the earliest stages of human history, people were nomadic hunters and gatherers.
Two facts stand out about the hunting-and- gathering “lifestyle”. • The first is that the food supply of these societies was not reliable, and as a consequence, population growth did not increase at a steady rate. • The second is that because a very large area of land was necessary to support a relatively small number of people, the Earth’s carrying capacity was low.
Stage 2: The Agricultural Revolution • The development of agriculture is considered one of the most important innovations in history. • The most important result of farming was the creation of a food surplus, which had some staggering impacts on society. • As more food could be obtained from each square km of land, the land’s carrying capacity grew.
Stage 3: The Industrial Revolution • The muscle-power of people and animals was not enough to run the new machines being developed. An energy crisis developed. • The solution was the invention of machines powered by steam. This lead to what we call the Industrial Revolution.
The earliest sources of power were ones that we now consider to be desirable because they relied on clean renewable resources. (windmills & hydro dams) • More powerful energy sources were developed later: coal, in the late 1700’s and oil in the late 1800’s.
Like the Agricultural Revolution, the Industrial Revolution fundamentally changed the nature of life in many ways… • Physical strength became less important than ones skills and intellect. • VS
Substantially fewer farm workers were needed to grow food. • Many out of work farm workers migrated to cities. This movement out of rural areas and into urban ones, continues even today. • The Earth’s carrying capacity was greatly increased by the Industrial Revolution as improved farming techniques lead to the production of more food per square kilometer.
Demographic Terms • Birth Rate: the number of births in a country for every thousand people. • # of births ÷ population x 1000 • 30+ is considered high • 15- is considered low • Canada’s birth rate was 11 per thousand in 2007
Death Rate: the number of deaths in a country for every thousand people. • # of deaths ÷ population x1000 • 30+ is high • 15- is low • Canada’s death rate was 8 per thousand in 2007 • Natural Increase Rate: is the difference between a country’s birth rate and death rate. • Birth rate – Death rate • Canada’s natural increase rate was 3 per thousand or 0.3% in 2007.
Immigration Rate: the number of people who permanently move to a country. • # of immigrants ÷ population x 1000 • Canada’s immigration rate was 7.2 per thousand between July, 2006 and July 2007. • Emigration Rate: the number of people who permanently leave a country. • # of emigrants ÷ population x 1000 • Canada’s emigration rate between July, 2006 and July, 2007 was 1.3per thousand.
Net Migration Rate: is the difference between the immigration and emigration rates. • Immigration – Emigration • Only a few countries have a large positive net migration rate (more moving in than out). Most countries have small negative net migration rates (more moving out than in). • Canada has a net migration rate of 5.9 per thousand, or 0.6%.
Population Growth Rate: is the change in a countries population, combining both the natural increase rate and net migration rate. • Natural Increase + or - Net Migration • 2% + is a high rate of growth. • Canada’s population growth rate is 0.9%.
Dependency Measures: are used to compare the population in the “dependant ages” (those who need to be housed, fed, educated, etc., for example those under 14 and those over 65) to those in the “working ages” of 15 to 64. • To many dependent people can put great stress on a country’s economy.
Two measures of dependency are commonly used… Dependency Load: Age-dependency Ratio: is the ratio of people in the “dependent” ages to those in the “working” ages. Canada’s 2007 ratio was 45% Pop. 14 & under + pop. 65 and older ÷ pop. 15 to 64 x 100 • is the percentage of the population that is under 14 and over 64 that must be supported by the independent, working population. • In 2007, Canada’s dependency load was 31%.
Infant Mortality Rate: Life Expectancy: The average lifespan of a human at birth. 50- years is low 75+ years is high Canada’s life expectancy in 2006 was 80 years. • Number of children who die in the first year of life for each 1000 births. • A measure of economic and social development. • 80+ is high • 15- is low • Canada’s infant mortality rate was 5.3 per thousand in 2006.
Population Pyramid: is a special type of graph that summarizes the age and gender structure of a population.
Total Fertility Rate: is the average number of children each woman will have in her fertile years (15-45 years of age). • 5+ is high • 2- is low • Canada’s fertility rate was 1.61 in 2007. • Replacement Rate: is the total fertility rate that produces a natural increase rate of zero. • You would think that 2 would be the rate to replace both parents, however the standard rate is 2.1. • The extra 0.1 is to replace women who chose not to or cannot have children, plus those who die before having children.
Rule of 70: is a simple way to estimate how long it would take for a country’s population to double. This excludes migration. • Canada’s growth rate is 1%. If it continues it will take 70 years for the population to double.