Download
1 / 1
10 likes | 110 Views
Comparison of Mathematical Models to Determine Molecular Weight of Proteins: A Statistical Analysis 1 Jennifer Wright, 2 Edward J. Carroll, Jr., 1 Lawrence Clevenson Department of 1 Mathematics and 2 Biology California State University Northridge NASA/PAIR Program.

E N D
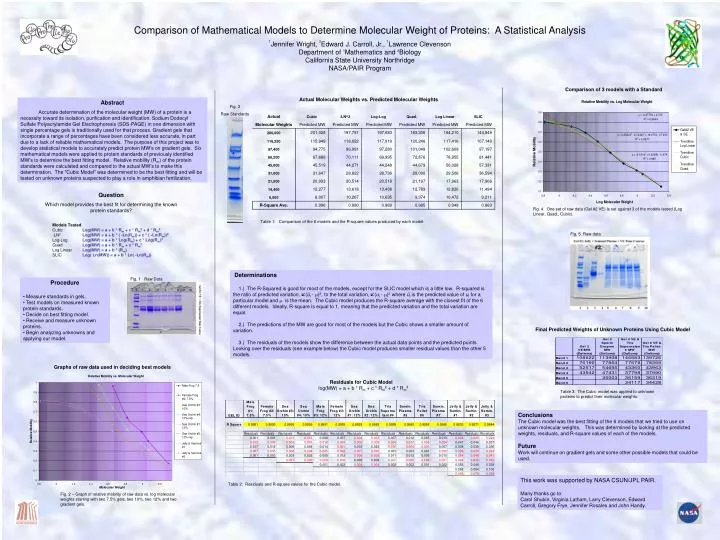
Comparison of Mathematical Models to Determine Molecular Weight of Proteins: A Statistical Analysis 1Jennifer Wright, 2Edward J. Carroll, Jr., 1Lawrence Clevenson Department of 1Mathematics and 2Biology California State University Northridge NASA/PAIR Program Comparison of 3 models with a Standard Actual Molecular Weights vs. Predicted Molecular Weights Abstract Accurate determination of the molecular weight (MW) of a protein is a necessity toward its isolation, purification and identification. Sodium Dodecyl Sulfate Polyacrylamide Gel Electrophoresis (SDS-PAGE) in one dimension with single percentage gels is traditionally used for that process. Gradient gels that incorporate a range of percentages have been considered less accurate, in part due to a lack of reliable mathematical models. The purpose of this project was to develop statistical models to accurately predict protein MW's on gradient gels. Six mathematical models were applied to protein standards of previously identified MW's to determine the best fitting model. Relative mobility (Rm) of the protein standards were calculated and compared to the actual MW's to make this determination. The "Cubic Model" was determined to be the best fitting and will be tested on unknown proteins suspected to play a role in amphibian fertilization. Fig. 3 Raw Standards Question Which model provides the best fit for determining the known protein standards? Fig. 4 One set of raw data (Gel #2 VE) is set against 3 of the models tested (Log Linear, Quad., Cubic). Table 1: Comparison of the 6 models and the R-square values produced by each model. Models Tested Cubic Log(MW) = a + b * Rm + c * Rm2 + d * Rm3 -LN2Log(MW) = a + b * ( -Ln(Rm)) + c * ( -Ln(Rm))2 Log-Log Log(MW) = a + b * Log(Rm) + c * Log(Rm)2 Quad Log(MW) = a + b * Rm + c * Rm2 Log Linear Log(MW) = a + b * (Rm) SLIC Log( Ln(MW)) = a + b * Ln( -Ln(Rm)) Fig. 5 Raw data Determinations 1.) The R-Squared is good for most of the models, except for the SLIC model which is a little low. R-squared is the ratio of predicted variation, (ûi - )2, to the total variation, (ui - )2 where ûi is the predicted value of ui for a particular model and is the mean. The Cubic model produces the R-square average with the closest fit of the 6 different models. Ideally, R-square is equal to 1, meaning that the predicted variation and the total variation are equal. 2.) The predictions of the MW are good for most of the models but the Cubic shows a smaller amount of variation. 3.) The residuals of the models show the difference between the actual data points and the predicted points. Looking over the residuals (see example below) the Cubic model produces smaller residual values than the other 5 models. Fig. 1 Raw Data • Procedure • Measure standards in gels. • Test models on measured known protein standards. • Decide on best fitting model. • Receive and measure unknown proteins. • Begin analyzing unknowns and applying our model. Final Predicted Weights of Unknown Proteins Using Cubic Model Graphs of raw data used in deciding best models Residuals for Cubic Model log(MW) = a + b * Rm + c * Rm2 + d * Rm3 Table 3: The Cubic model was applied to unknown proteins to predict their molecular weights. Conclusions The Cubic model was the best fitting of the 6 models that we tried to use on unknown molecular weights. This was determined by looking at the predicted weights, residuals, and R-square values of each of the models. Future Work will continue on gradient gels and some other possible models that could be used. This work was supported by NASA CSUN/JPL PAIR. Many thanks go to: Carol Shubin, Virginia Latham, Larry Clevenson, Edward Carroll, Gregory Frye, Jennifer Rosales and John Handy. Table 2: Residuals and R-square values for the Cubic model. Fig. 2 – Graph of relative mobility of raw data vs. log molecular weights starting with two 7.5% gels, two 10%, two 12% and two gradient gels.