Download
1 / 2
20 likes | 131 Views
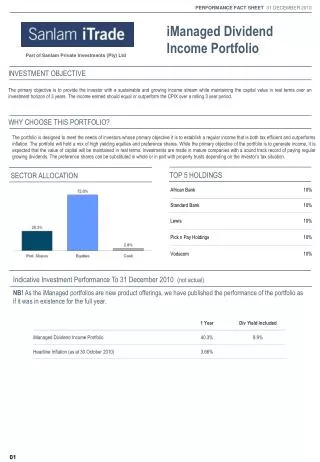
PERFORMANCE FACT SHEET 31 DECEMBER 2010. iManaged Aggressive Technical Portfolio. Part of Sanlam Private Investments (Pty) Ltd. INVESTMENT OBJECTIVE.

E N D
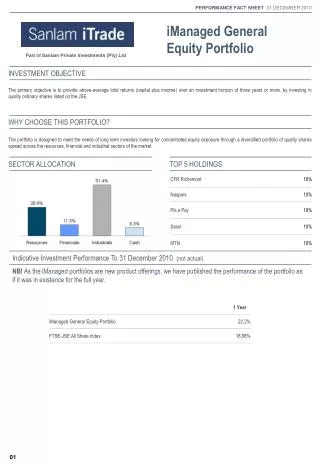
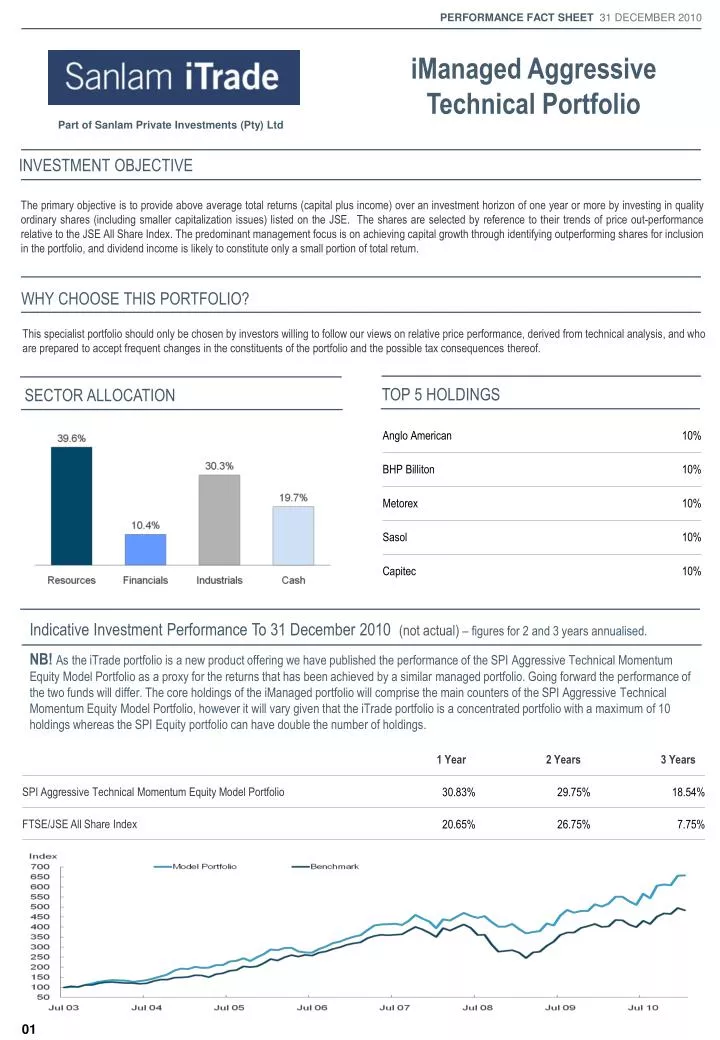
PERFORMANCE FACT SHEET31 DECEMBER 2010 iManaged Aggressive Technical Portfolio Part of Sanlam Private Investments (Pty) Ltd INVESTMENT OBJECTIVE The primary objective is to provide above average total returns (capital plus income) over an investment horizon of one year or more by investing in quality ordinary shares (including smaller capitalization issues) listed on the JSE. The shares are selected by reference to their trends of price out-performance relative to the JSE All Share Index. The predominant management focus is on achieving capital growth through identifying outperforming shares for inclusion in the portfolio, and dividend income is likely to constitute only a small portion of total return. WHY CHOOSE THIS PORTFOLIO? This specialist portfolio should only be chosen by investors willing to follow our views on relative price performance, derived from technical analysis, and who are prepared to accept frequent changes in the constituents of the portfolio and the possible tax consequences thereof. TOP 5 HOLDINGS SECTOR ALLOCATION Indicative Investment Performance To 31 December 2010 (not actual) – figures for 2 and 3 years annualised. NB! As the iTrade portfolio is a new product offering we have published the performance of the SPI Aggressive Technical Momentum Equity Model Portfolio as a proxy for the returns that has been achieved by a similar managed portfolio. Going forward the performance of the two funds will differ. The core holdings of the iManaged portfolio will comprise the main counters of the SPI Aggressive Technical Momentum Equity Model Portfolio, however it will vary given that the iTrade portfolio is a concentrated portfolio with a maximum of 10 holdings whereas the SPI Equity portfolio can have double the number of holdings. 01
PERFORMANCE FACT SHEET31 DECEMBER 2010 iManaged Aggressive Technical Portfolio Part of Sanlam Private Investments (Pty) Ltd ABOUT THE PORTFOLIO MANAGER ABOUT THE PORTFOLIO • Rob has more than 40 years experience in stockbroking and technical analysis in the international arena • He is a Senior Portfolio Manager at Sanlam Private Investments ROB FIRTH Member of S.A. Institute of Stockbrokers PORTFOLIO MANAGER’S COMMENTS CONTACT INFORMATION To have an online managed portfolio, go to www.sanlamitrade.co.za and click on the “iManaged" link to register or contact admin@sanlamitrade.co.za or elanzam@spi.sanlam.com. For admin queries phone Elanza on: 086 062 7278 Portfolio Manager: robf@spi.sanlam.com Tel (031) 560 3600 Following a promising opening two weeks local shares came under pressure later in the month as the FTSE/JSE Africa All Share (ALSI) declined 2.15% on a total return basis during the month. Large Caps (-1.7%) outperformed Small Caps (-3.6%) and Mid Caps (-4.8%). The best performing sectors were Coal Mining (+7.4%), Forestry & Paper (+7.0%) and Industrial Metals (+5.2%). The Construction & Materials sector continued to suffer on the back of a very poor trading update of Murray and Roberts and closed the month 12% down from its opening levels. From a foreigner’s perspective, the rand’s depreciation against the US$ in January has detracted from the performance of the ALSI (-9.7% in US$ terms). However, the MSCI World index gained 2.3% on a total return basis in US$ terms outperforming its emerging market peers which lost 2.7% on average. The All Bond Index declined 2.14%, the Inflation-Linked Bond Index declined 0.43% and cash returned 0.47%. Early in January we increased our exposure to Anglo and Exxaro and in mid-January, sold our remaining retailers, Foschini and Spar, as this sector came under major selling pressure and underperformed the JSE All Share Index. We remained overweight resources and underweight industrials. MANDATORY DISCLOSURE Participation in the iTrade Dividend Income Model Portfolio is a medium to long-term investment. The value of this portfolio is subject to fluctuation and past performance is not necessarily a guide to its future performance. Calculations are based on a lump sum investment with gross income reinvested on the ex-dividend date. All terms exclude costs. Actual investment performance will differ based on the fees applicable, the actual investment date and the date of reinvestment of income. A schedule of fees and maximum commissions is available from the manager. 02