Download

1 / 43
440 likes | 891 Views
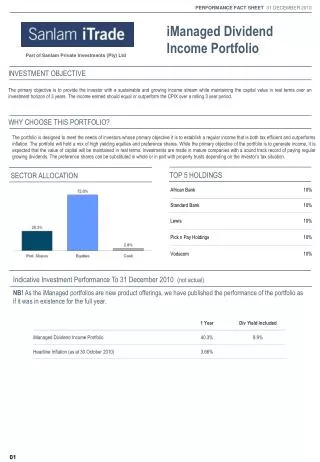
Tactical Asset Allocation and Sector Rotation. Nantucket Asset Management, L.L.C. Thomas P. Dunn, CFA . Disclaimer.

E N D
Tactical Asset Allocation and Sector Rotation Nantucket Asset Management, L.L.C. Thomas P. Dunn, CFA copyright 2002-2005 Nantucket Asset Management, L.L.C. All Rights Reserved.
Disclaimer The information found in this presentation is intended solely to provide general information pertaining to our investment advisory services. This information should not be construed as presenting personalized investment advice for compensation. Nantucket Asset Management, L.L.C. transacts business only in those states in which it is registered or qualifies for an exemption or exclusion from registration requirements. For further information regarding Nantucket Asset Management, L.L.C. services, please contact Thomas P. Dunn, CFA, Chief Investment Officer, at (609) 750-0788. copyright 2002-2005 Nantucket Asset Management, L.L.C. All Rights Reserved.
“The Father’s Refutation” to a Lemming Son: “If all of the other boys jump in the lake, does that make it right?” copyright 2002-2005 Nantucket Asset Management, L.L.C. All Rights Reserved.
Why Tactical Asset Allocation Now? Current opportunities are ripe for volatile fluctuating markets over the next several years, the ideal conditions in which Tactical Asset Allocation can outperform: • The potential for shocks have increased due to geopolitical instability. • Valuations remain relatively high in a long-term historical context. • Leveraged trading by unregulated hedge funds should continue to contribute to volatility. • The use of Portfolio Insurance by institutions amplifies the momentum of upward trends and restrictive pullbacks. • Investor herd mentality exacerbates compulsive buying and panic selling. • Without a balance between macro valuations, quantitative potentials and bottom up fundamental analysis, analysts can miss major movements. • Many investors hold an underlying defeatist belief in Efficient Markets, which requires holding at the extremes and curiously ensures they never outperform. • After a consecutive multi-year bear market, mass market psychology changes dramatically. Equity markets historically have become volatile for an extended period. copyright 2002-2005 Nantucket Asset Management, L.L.C. All Rights Reserved.
Long Bull Market Expansions: copyright 2002-2005 Nantucket Asset Management, L.L.C. All Rights Reserved.
Chart of Long Expansive Bull Markets copyright 2002-2005 Nantucket Asset Management, L.L.C. All Rights Reserved.
The 1987 Bear Market and Investor Psychology • The S&P 500 opened at 314 on October 14, 1987. Four trading days later, it hit a low of 216 on October 20, 1987. Although the market had fallen 31%, the 1987 bear market only lasted 4 days! Despite subsequent intra-month volatility, the market began a fairly steady recovery the following month that was fully complete 18 months later. • Investor psychology is affected by word of mouth in country clubs, board rooms, restaurants and trading floors over many months and years. Consecutive multi-year bear markets have a more profound and lasting effect on how investors view equity investments. • If the 2000-2002 bear market is like prior multi-year consecutive bear markets, investors will not wait as long to sell falling equities during future panics. They will not wish to be left holding a declining stock portfolio for, what they imagine, could again, be years. copyright 2002-2005 Nantucket Asset Management, L.L.C. All Rights Reserved.
Long Volatile Markets Follow Long Bears Long Flat and volatile periods tend to begin begin after consecutive multi-year bear markets. Such periods historically have consisted of a series of profitable opportunistic recoveries for the faithful and sharp painful panics for the hopeful. copyright 2002-2005 Nantucket Asset Management, L.L.C. All Rights Reserved.
Flat and Volatile Periods: copyright 2002-2005 Nantucket Asset Management, L.L.C. All Rights Reserved.
Chart of Volatile Periods that Follow Long Bull Markets copyright 2002-2005 Nantucket Asset Management, L.L.C. All Rights Reserved.
What we can expect this decade • Economic recoveries and very strong rebounds in stock prices have historically followed significant bear market troughs. Two-year price rebounds typically enjoyed 50% ascents from bottoms. More drawn out recoveries from the more severe bear markets experienced even higher appreciations. • Earnings recoveries tended to raise investors’ hopes for previous market Price-Earning ratios only to result in disappointment. The rebound tended to be followed by a violent panic that was unsuccessful in testing the initial bear market low. copyright 2002-2005 Nantucket Asset Management, L.L.C. All Rights Reserved.
Types of Asset Allocation Strategies • Buy and Hold • Asset Allocation adjusts only due to changes of the security prices in the portfolio. Performs best in long bull markets. • Fixed Weight Disciplined Rebalancing • A strategic asset allocation is chosen based on long-run market return and volatility expectations extrapolated from historical experience. Future changes in market price levels do not affect the perceived risk assumed at the time of the initial investment and static asset allocation decision. Performs well in volatile but rising markets. • Portfolio Insurance • Risk tolerance increases as market prices and portfolio value rises. In response to rising prices, exposure to the risky (stock) asset class is increased further. Efforts are made to cash out in falling markets prior to reaching a portfolio floor level, at which point the investor has zero tolerance for risky assets. • Tactical Asset Allocation copyright 2002-2005 Nantucket Asset Management, L.L.C. All Rights Reserved.
Tactical asset allocation seeks to improve investment horizon returns and reduce downside risk relative to fixed weight balanced accounts during volatile markets. Tactical asset allocation increases equity exposure at low market levels and seeks to increase exposure to fixed income securities near market tops. Most investment firms use a fixed weight allocation of 60% stocks and 40% fixed income securities for their balanced client accounts. Active tactical asset allocation seeks to outperform these relatively passive weighted portfolios. Goal of Tactical Asset Allocation copyright 2002-2005 Nantucket Asset Management, L.L.C. All Rights Reserved.
Limitations of a fixed 60/40 Strategy • Investment firms using fixed weight asset allocation strategies invested 60% of new balanced portfolios in equities in mid March 2000 and subsequently watched the S&P fall 50% through mid October 2002. If the strategy was properly maintained with a 60% equity weighting, bonds should have been sold during these 31 months to fund the purchase of falling equities. • Cash at market tops provides the financial flexibility to acquire more equity shares as prices fall. The fixed weight balanced strategy essentially ignores prices in its implementation. Users place their trust in the prices set by an efficient market. No serious attempt is made to proactively forecast potential market performance. • The 60/40 strategy underperforms a Buy and Hold strategy in long upward trending markets and underperforms Tactical Asset Allocation in bear markets and volatile markets. copyright 2002-2005 Nantucket Asset Management, L.L.C. All Rights Reserved.
Anomalies or Regularities? Those that believe in efficient markets often refer to “anomalies” when recurring patterns are pointed out. According to the efficient market hypothesis, in which prices reflect all information, recurring tendencies are ignored since proponents expect the pattern to be exploited away. To them, every situation is unique, and there is no way to outperform in the rational and fully informed efficient market. copyright 2002-2005 Nantucket Asset Management, L.L.C. All Rights Reserved.
When are Government Policies Implemented that Affect the Markets? copyright 2002-2005 Nantucket Asset Management, L.L.C. All Rights Reserved.
Market Volatility In his 1989 book, Market Volatility, Robert Shiller showed that the most significant cause of market volatility is mass market psychology. Academic models of perfect valuation are rarely realized in actuality. Prices fluctuate much more in the short-run and the intermediate-term than can be explained by rational algebraic valuation models or by the release of changing information. Due to greed and fear, investors overreact both on the high and low side. copyright 2002-2005 Nantucket Asset Management, L.L.C. All Rights Reserved.
Annual Equity Ranges copyright 2002-2005 Nantucket Asset Management, L.L.C. All Rights Reserved.
Asset Allocation Determines 95% of a Portfolio’s Return In a 1986 study of the 10-year performance of large pension funds, Brinson, Hood and Beebower found a 0.95 r-squared correlation between asset allocation and fund performance. Therefore, only 5% of the portfolios’ returns, on average over the 10-year period, were due to such things as security selection and transaction costs. copyright 2002-2005 Nantucket Asset Management, L.L.C. All Rights Reserved.
Time to be Proactive The best time to convert to a Tactical Asset Allocation Strategy is prior to market tops. On a short-term basis moving upward at the high end of frothy market levels, Tactical Asset Allocation Strategies tend to underperform fixed weight balanced portfolios due to higher cash positions. However, throughout an entire flat but volatile cycle, and during declining markets, and especially early in recoveries, Tactical Asset Allocation outperforms. Tactical Asset Allocation also reduces downside volatility throughout most of the cycle. copyright 2002-2005 Nantucket Asset Management, L.L.C. All Rights Reserved.
Tactical Asset Allocation Methodologies • A relatively small number of dedicated investment firms have used different methodologies in Tactical Asset Allocation with varying degrees of success in performance, turnover and volatility including: • Dividend Discount Model tactics • Risk Premium tactics • FED policy tactics • Business Cycle tactics • Nantucket Asset Management, L.L.C. uses innovative tactics based primarily on two-year range estimates of the larger market. Business cycle dynamics are built into the strategy. While other tactics may attempt to maximize month to month returns relative to rising or falling indexes, our aim is to enhance investment horizon returns as opportunities arise while reducing downside risk at frothy market levels. copyright 2002-2005 Nantucket Asset Management, L.L.C. All Rights Reserved.
The Economic/Stock Price Cycle In his 2000 Book, Stock Market Cycles, Steven E. Bolten offers a four phase model of the economic/stock price cycle. Economic Activity Stock Prices Interest Rates I II III IV Bias : Equity Bonds Equity Bonds Cash Equity & Bonds Bonds Reduce: copyright 2002-2005 Nantucket Asset Management, L.L.C. All Rights Reserved.
Restrictive Monetary Policy copyright 2002-2005 Nantucket Asset Management, L.L.C. All Rights Reserved.
Expansionary Monetary Policy copyright 2002-2005 Nantucket Asset Management, L.L.C. All Rights Reserved.
S&P 500 Percentage Change during Expansive and Restrictive Monetary Policies (based on directional changes in the discount rate) copyright 2002-2005 Nantucket Asset Management, L.L.C. All Rights Reserved.
Real Interest Rates, GDP Housing Prices and Unemployment copyright 2002-2005 Nantucket Asset Management, L.L.C. All Rights Reserved.
Yield Curve copyright 2002-2005 Nantucket Asset Management, L.L.C. All Rights Reserved.
Popular Model: The Rule of 20 copyright 2002-2005 Nantucket Asset Management, L.L.C. All Rights Reserved.
Tax Rates copyright 2002-2005 Nantucket Asset Management, L.L.C. All Rights Reserved.
Historical S&P 500 Operating Earnings 1967-1971: $5.33, $5.76, $5.78, $5.13, $5.70 1972: $6.42 1973-1975: $8.16, $8.89, $7.96 1976-1978: $9.91, $10.89, $12.33 1979-1986: $14.86, $14.82, $15.36, $12.64, $14.03, 16.64, $14.61, $14.48 1987: $17.50 1988-1993: $24.12, $24.32, $22.65, $19.30, $20.87, $26.90 1994-1996: $31.75, $37.70, $40.63, 1997-2002: $44.01, $44.27, $51.68, $56.13, $38.85, 46.04 2003-2005: $54.69, $68.01, $75 Estimated (Green years represent earnings breakouts from plateau groupings.) copyright 2002-2005 Nantucket Asset Management, L.L.C. All Rights Reserved.
Example Range Estimates for S&P 500 through 2006 copyright 2002-2005 Nantucket Asset Management, L.L.C. All Rights Reserved.
Probability Distribution is skewed (dashed line) due to a historic tendency of strong recoveries from multi-year bear market lows with additional support from the Presidential Cycle. Therefore we apply a positive equity bias in 2003, which we continue at a reduced level in the early months of 2004. Equity Bias “Bell Shaped” Normal Probability Distribution (Solid Line) 765 S&P 500 1575 copyright 2002-2005 Nantucket Asset Management, L.L.C. All Rights Reserved.
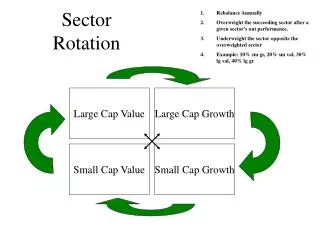
During Economic Recovery Aerospace Automobile Manufacturers Building Materials Food Footwear Household Furnishings Household Products Life Insurance Broadcasting Paper Publishing Railroads Retail Stores During Late Stage Expansion Aluminum Non-alcoholic Beverages Electrical Equipment Gold and Precious Metals Household Products Diversified Machinery Money Center Banks Oil and Gas Drilling Oil International Tobacco Historical Tendencies of Sectors to Outperform copyright 2002-2005 Nantucket Asset Management, L.L.C. All Rights Reserved.
Technology Bubble Took 18 Months to Fully Inflate copyright 2002-2005 Nantucket Asset Management, L.L.C. All Rights Reserved.
Oil Prices copyright 2002-2005 Nantucket Asset Management, L.L.C. All Rights Reserved.
Seasonality of West Texas Intermediate Oil Percentage Changes copyright 2002-2005 Nantucket Asset Management, L.L.C. All Rights Reserved.
Oil in Dollars and Euros copyright 2002-2005 Nantucket Asset Management, L.L.C. All Rights Reserved.
Exchange Rate Volatility copyright 2002-2005 Nantucket Asset Management, L.L.C. All Rights Reserved.
Real Interest Rates and the Value of the Dollar copyright 2002-2005 Nantucket Asset Management, L.L.C. All Rights Reserved.
Tactical Considerations • The amplifying and offsetting influences of very long- term cycles, business cycle effects on industries, the Presidential cycle, seasonal tendencies, geopolitical effects, demographics, price shocks, and the changing mood of domestic and international investors lead to deviations from market and industry theoretical price levels based on a discounted stream of long-term dividends. • Properly applied, Tactical Asset Allocation makes active use of low cost index surrogates and rotates industry sector exposure in response to the business cycle. copyright 2002-2005 Nantucket Asset Management, L.L.C. All Rights Reserved.
Is Tactical Asset Allocation Appropriate for You? copyright 2002-2005 Nantucket Asset Management, L.L.C. All Rights Reserved.
Appropriateness of Tactical Asset Allocation Tactical Asset Allocation is a timely asset allocation strategy for the expected market conditions throughout this decade. The appropriateness of Tactical Asset Allocation, however, is also determined by the structure of an investor’s liabilities. Tactical Asset Allocation can be most appropriate for taxable accounts and capital gains tax-exempt portfolios including: • Endowments • Foundations • IRAs • Charitable Accounts • Profit Sharing Plans copyright 2002-2005 Nantucket Asset Management, L.L.C. All Rights Reserved.
For Additional Information Contact: Thomas P. Dunn, CFA Chief Investment Officer & Senior Portfolio Manager (609 )750-0788 Nantucket Asset Management, L.L.C. 660 Plainsboro Road, Suite 486 Plainsboro, NJ 08536 www.nantucketassetmanagement.com copyright 2002-2005 Nantucket Asset Management, L.L.C. All Rights Reserved.