Download
1 / 53
540 likes | 712 Views
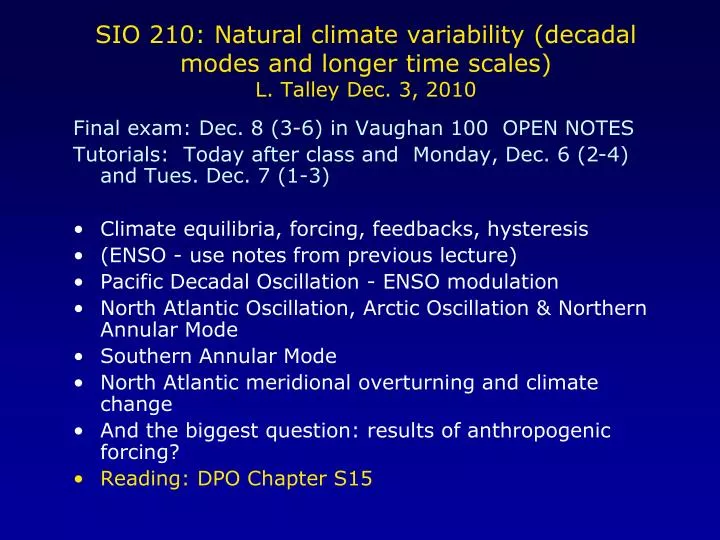
SIO 210: Natural climate variability (decadal modes and longer time scales) L. Talley Dec. 3, 2010. Final exam: Dec. 8 (3-6) in Vaughan 100 OPEN NOTES Tutorials: Today after class and Monday, Dec. 6 (2-4) and Tues. Dec. 7 (1-3) Climate equilibria, forcing, feedbacks, hysteresis

E N D
SIO 210: Natural climate variability (decadal modes and longer time scales)L. Talley Dec. 3, 2010 Final exam: Dec. 8 (3-6) in Vaughan 100 OPEN NOTES Tutorials: Today after class and Monday, Dec. 6 (2-4) and Tues. Dec. 7 (1-3) • Climate equilibria, forcing, feedbacks, hysteresis • (ENSO - use notes from previous lecture) • Pacific Decadal Oscillation - ENSO modulation • North Atlantic Oscillation, Arctic Oscillation & Northern Annular Mode • Southern Annular Mode • North Atlantic meridional overturning and climate change • And the biggest question: results of anthropogenic forcing? • Reading: DPO Chapter S15
Elements of the climate system Atmosphere Ocean Land surface Biological and chemical cycles
Climate variability vs. climate change • current common usage and in, e.g., the Intergovernmental Panel on Climate Change (IPCC) usage • “Climate variability” = natural variability • Natural “modes” of variability • “Climate change” = anthropogenic forcing • (due to man-made changes in greenhouse gases, land surfaces, species distributions, etc.)
Climate forcing External forcing for earth’s climate includes earth orbit parameters (solar distance factors) solar luminosity moon orbit volcanoes and other geothermal sources tectonics (plate motion) greenhouse gases (to the extent that they are not part of the climate system itself) land surface (likewise with respect to the climate system) Internal forcing: looking at each element of the climate system and how it is forced by another element (e.g. winds forcing ocean, change in ice extent forcing atmosphere or ocean, etc) Interactions – sometimes include feedbacks
Natural climate modes with interannual to millenial time scales that involve the ocean ENSO: interannual time scale (> 1 year, < 10 years) Pacific Decadal Oscillation: decadal time scale North Atlantic Oscillation or Arctic Oscillation or Northern Annular Mode: decadal time scale Southern Annular Mode: decadal time scale Atlantic overturning mode: centennial time scale (centennial and longer time scales - VERY sparse data sets, require more modeling to isolate processes) What sets the time scales? decadal to centennial suggests longer processes than just atmosphere - for instance ocean circulation or changes in land surface
Stability and equilibria Asymptotically stable: force system away from initial condition and the system returns to initial state Stable or Neutral: force away and system stays where it was pushed to (not illustrated here). Unstable: force away and system moves to a different state. This usually implies multiple possible stable equilibria, with forcing that is strong enough to push into a different equilibrium state. Kump, Kasting and Crane (2003)
Forcing (coupling) with no feedback Negative coupling Volcano eruption Temperature decrease Reduction in sunlight • Cause and effect: example of negative coupling (increase in one parameter causes a decrease in the other) • Volcano causes aerosols • Causes cooling and decrease in temperature Feedback? None since air temperature does not change incidence of volcanoes
Positive feedbacks Albedo = reflectivity, scale of 0-1 with 0 = no reflection, 1 = all reflected • Example: ice-albedo feedback • Increased ice and snow cover increases albedo • (Positive coupling, denoted by arrow) • Increased albedo decreases temperature of atmos. • (negative coupling, denoted by circle) • Decreased temperature of atmos. Causes ice increase • (negative coupling, denoted by circle) • Two negatives cancel to make positive; net is positive feedback (“runaway”, unstable) Reflection increase Ice increase Positive coupling Negative coupling Negative coupling Temperature decrease
How might the ocean feed back on climate modes and create decadal to centennial to millenial time scales? Note that advection time scales are similar to these climate modes: ocean gyres - decades ocean basins - centuries global ocean - ~1000 years (1) Advection of heat and salinity anomalies: from surface forcing regions, subducted, and then returning to surface where they change the forcing for the atmosphere, or change the ice extent. (2) Or similar advection that changes the upper ocean stratification, hence changing the mixed layer depths heated and cooled by the same air-sea fluxes, thus changing surface temperature (3) Or propagation of anomalies via Rossby or Kelvin waves, which then reset the temperature in remote locations.
Stability and equilibria for the ocean: can the N. Atlantic “conveyor” turn on and off and what would be the result for climate? Cooling, freshening Warming, evaporation Rahmstorf, Nature, 2002
North Atlantic thermohaline circulation variations - millenial time scales and abrupt climate change (1) If, say, fresh water is dumped on the northern North Atlantic through excessive melting or runoff, how will the N. Atlantic overturning circulation change? Will it: Absorb the freshwater and return to nearly the initial condition (asymptotically stable)? (stay in the initial equilibrium state) Shift to a slightly different state and remain there? (neutrally stable) (stay in essentially the same equilibrium state) Jump into a completely different state of overturn (unstable)? (new equilibrium state) (2) If the freshwater forcing is continuously changing (increasing and decreasing), what is the response? (“hysteresis” predicted)
Salt oscillator (Stommel 1961): example of hysteresis Cooling, freshening Warming, evaporation Model: (1) increase freshwater at high latitudes. Starts to reduce overturn and reduce high latitude SST slightly. Then overturn shuts off, SST drops abruptly. (2) Reduce freshwater at high latitudes. Takes a long time to restore overturn - overshoot (hysteresis) DPO section 7.10.4 NADW formation rate
North Atlantic thermohaline circulation variations - millenial time scales and abrupt climate change Rahmstorf, Nature, 2002
Can the N. Atlantic “conveyor” change? Interest in change since it would have some consequences for subpolar SST and for the storm tracks that might respond to location and strength of ocean fronts Cartoon of “conveyor” and measurement arrays in place from Quadfasel (Nature, 2005)
North Atlantic salinity variations Can these changes in surface salinity create changes in circulation? Curry (WHOI)
Observed changes: Freshening of the Atlantic and Nordic Seas(Dickson et al, Phil Trans Roy Soc 2003)
Labrador Sea Water variations (Dickson et al., and I. Yashayaev)
Is the N. Atlantic “conveyor” changing, possibly in response? Bryden et al. (Nature, 2005) measurements at 25°N suggested a slowdown. They have since withdrawn this conclusion – their results were probably aliased by the large seasonal cycle. Cartoon of “conveyor” and measurement arrays in place from Quadfasel (Nature, 2005)
Natural climate modes with decadal time scales that involve the ocean ENSO: interannual time scale (earlier lecture) Pacific Decadal Oscillation: decadal time scale North Atlantic Oscillation or Arctic Oscillation or Northern Annular Mode: decadal time scale Southern Annular Mode: decadal time scale Atlantic overturning mode: centennial time scale (centennial and longer time scales - sparse data sets, require more modeling to isolate processes) What sets the time scales? decadal to centennial suggests longer processes than just atmosphere - for instance ocean circulation or changes in land surface
The PDO versus ENSO Pacific Decadal Oscillation pattern (sort of EOF): tropics and Aleutian Low ENSO pattern (sort of an EOF): mostly tropical 20-30 year time scale 3-7 year time scale Similar patterns, but ENSO is very peaked in the tropics, and the PDO is spread out to higher latitudes, particularly N. Pacific.
Pacific Decadal Oscillation time series (Mantua and Hare) 1976 “regime shift” to warm phase PDO, strong Aleutian Low Great website: http://tao.atmos.washington.edu/pdo/ The PDO was high after about 1976 (“regime shift”) and stayed pretty high until the late 1990s. It looked like it was entering a low phase, but we are back in high. Lesson for decadal modes: don’t know what you have until you are many years into them.
Aleutian Low, ocean circulation and decadal change? Stronger A.L. strengthens subpolar gyre and weakens subtropical gyre - result is ocean warming along North America Subpolar gyre Subtropical gyre
SST changes due to changing winds and circulation Stronger Ocean currents weaker COOLING WARMING westerlies When the Aleutian Low is strong, get: Adapted from Miller, Chai, Chiba, Moisan and Neilson (J. Oceanogr., 2004)
The Arctic Oscillation (or North Atlantic Oscillation or Northern Annular Mode)“High” and “Low” refer to the anomaly of atmospheric pressure difference between the Azores and Iceland
NAO SST pattern High NAO: Warm subtropical N. Atlantic, warm subtropical N. Pacific Cool subpolar N. Atlantic, cool subpolar N. Pacific i.e. also associated with weak Aleutian Low
Where are we in the NAO?High or neutral http://www.cgd.ucar.edu/cas/jhurrell/indices.html
N. Atlantic changes: decrease in oxygen at base of the surface layer -> reduction in upper ocean ventilation(concomitant increase in Labrador Sea ventilation) (Gruber, 2004; Johnson, 2004;Feely et al 2005)
N. Atlantic oxygen changes: ascribed to high NAO since about 1989, reduced ventilation in the NE Atlantic(Gruber, 2004)
Arctic Oscillation surface temperature variations (land) (Wallace) High AO: Cold high latitudes (Canada, Labrador Sea) Warm Siberia and continental US, warm subtropics
Southern Annular Mode NAM Circumpolar mode; variation in surface pressure and hence in westerly and polar easterly wind strength
Anthropogenic climate change The ocean is an excellent integrator of change since its heat capacity is large, and it is an enormous reservoir for freshwater (compared with the atmosphere). Long-term trends in heat content, salinity and oxygen are observed. Necessary to integrate over large areas to see this signal separate from the decadal natural modes. Patterns of A.C.C. might well resemble the natural climate modes since these are, after all, the natural modes that would be forced into a particular state. Relation to anthropogenic climate change is made through relation to atmosphere trends that are footprints of A.C.C. (night vs. day temperature, troposphere vs. stratosphere heating/cooling, low vs. high latitude warming)
Observed global ocean changes that might be anthropogenic (Levitus et al 2005) 0.037°C warming (0-3000 m)
Is there anthropogenic climate change? • Yes (IPCC TAR) Levitus et al (2000) heat storage changes in the North Pacific, Pacific, World
Observed changes: basin-scale temperatureMostly warming but some cooling (presented by H. Garcia). Especially note cooling in high latitude Atlantic and Pacific, tropical Pacific and Indian. Not just noise.
Observed changes: Southern Ocean(Gille, Science 2002) Broad warming in southern ocean at about 800 meters Also note cooling to the north of the warm band Accompanied by cooling in central Antarctica This looks like the Southern Annular Mode pattern. Natural climate modes might also be forced by anthropogenic change.
Variations in central N. Pacific temperature, salinity and density between 1985 and 2004 (Robbins, pers. comm. 2004)Using CFCs measured concurrently, he is concluding that this is at least partially anthropogenic
Large-scale salinity changes: fresh areas freshening and salty areas getting saltier. Suggests increase in atmospheric hydrological cycle, which would be expected in a warmer world. This can only be observed with ocean salinities rather than with trends in evaporation-precipitation since the latter data sets are very noisy. Fresher, cooler Saltier Fresher Fresher Saltier Saltier Fresher
Daisyworld - simple model of feedbacks (Lovelock) • Model designed to demonstrate simple feedbacks that can affect climate • Albedo: fraction of light that is reflected. Totally reflected: albedo = 1 No reflection: albedo = 0 Albedo depends on the material • Snow • Ice • Dirt • Grass • Clouds • Concrete • Water Reasonable initial T Negative feedback High initial T Positive feedback • http://gingerbooth.com/courseware/daisy.html
Pacific Decadal Oscillation SST and SLP patterns: note similarity of SST to ENSO pattern and also large amplitude in the central N. Pacific
Pattern for the PNA (like the NPI): this is an intriguing pattern, suggesting a connection to the Southern Ocean (Southern Annular Mode) North Atlantic Oscillation pattern correlated with sea level pressure Pacific North American pattern correlated with sea level pressure
Decadal variations in ENSO associated with ocean subtropical changes (McPhaden and Zhang)
What about changing N. Atlantic meridional overturning? • Freshening of subpolar N. Atlantic is intriguing • Stommel model and many more sophisticated models exploring effect of freshwater dump on subpolar N. Atlantic • Freshening would weaken the overturning circulation • Bryden et al. (2005) and other somewhat recent papers reporting possible decrease in overturning circulation at 24N and at the Nordic Seas overflows • But present consensus is probably that ascribing variations to anthropogenic forcing is difficult since natural variations (NAO or NAM) are so large
Is the N. Atlantic conveyor changing?This week in Nature (vol. 438, 1 December 2005) Bryden et al (2005) Repeat hydrographic sections at 24N in the N. Atlantic Transport per unit depth Upper ocean Deep ocean
Is the N. Atlantic conveyor changing?This week in Nature (vol. 438, 1 December 2005) Bryden et al (2005)
Variations in central Pacific continued 1000 27.0 T S density T S Warming from surface to about 1000 m (27.2 sigma0) Salinification to about 800 m (27.0 sigma0)